Source Details
The Source Details page shows informational items about the current source, regardless of the target.
The details listed are grouped into three areas:
Identity | Lists information helping identify the scanned source/instance being analyzed on this page. |
Resources | Lists information helping to understand the computing resources used by the source. |
Metrics | Lists key dimensional details that help understand the scale or operational characteristics of the source. |
The content of each area varies by the source database engine type:
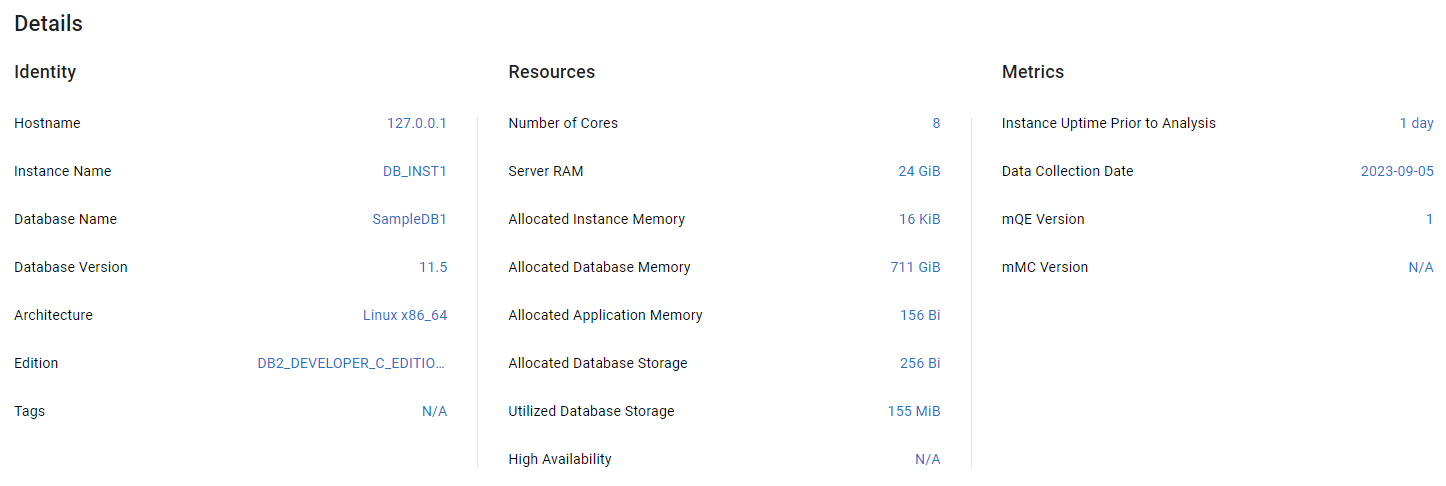
The parameters shown for DB2 LUW are:
Area | Parameter | Description |
|---|---|---|
Identity | Hostname | Name or IP address of the server that hosts the source database. |
Instance Name | Name of the database instance. | |
Database Name | Name of the source database. | |
Database Version | Version of the source database. | |
Architecture | OS architecture of the host on which the database is running. | |
Edition | Edition of the source database version. | |
Tags | Any custom tags assigned to this source during scan. | |
Resources | Number of Cores | Number of CPU cores. Derived using the CPU_TOTAL column in the ENV_GET_SYSTEM_RESOURCES table. |
Server RAM | Server memory available on the host where the DB is running. Derived using the MEMORY_TOTAL column in the ENV_GET_SYSTEM_RESOURCES() table function. | |
Allocated Instance Memory | Server memory allocated for the database. Derived using the MAX_MEMBER_MEM column in the ADMIN_GET_MEM_USAGE table function. | |
Allocated Database Memory | Amount of memory that is currently being used by a database. Derived from the SUM of values using the MEMORY_SET_SIZE column in the MON_GET_MEMORY_SET table function. | |
Allocated Application Memory | Maximum amount of memory that can be allocated to service application requests. Derived from the SUM of values using the MEMORY_SET_SIZE column where MEMORY_SET_TYPE is application from the MON_GET_MEMORY_SET table function. | |
Allocated Database Storage | Disk space used by the database data files. Derived from the SUM of values using the TBSP_TOTAL_PAGES and TBSP_PAGE_SIZE columns in the MON_GET_TABLESPACE table function. | |
Utilized Database Storage | Amount of storage space that is currently being used by the database. Derived from the SUM of values using the TBSP_USED_PAGES and TBSP_PAGE_SIZE columns in the MON_GET_TABLESPACE table function. | |
High Availability | High availability is configured for the source database. | |
Metrics | Instance Uptime Prior to Analysis | Number of days the database was running since it was last restarted. |
Data Collection Date | Date on which the database scan was run. | |
mQE Version | Version of the Query Definitions file that was used by the mMC to collect the data. | |
mMC Version | Version of the migVisor Metadata Collector used to run the scan. |

The parameters shown for HBase are:
Area | Parameter | Description |
|---|---|---|
Identity | HBase Cluster Id | HBase cluster unique Id as reported by the HBase |
HBase Version | HBase version as reported by the | |
ZooKeeper Quorum | ZooKeeper quorum address, as detected in configuration entry | |
Cluster Key | Key that can be used to add this current cluster as a replication peer by another HBase cluster using the | |
Tags | Any custom tags assigned to this source during scan. | |
Resources | ZooKeeper Base Path | Root node of this cluster in ZooKeeper, as detected in configuration entry |
Load Balancer |
| |
Access Control | Access Control is enabled or disabled for the source database. | |
HBase Root Directory | Path to the HBase root directory on the underlying Hadoop cluster. | |
HDFS Space Consumed | Bytes used across HDFS, accounting for replication. This includes all HDFS data stored under the HBase root folder in Hadoop, counting all replicated blocks. Copies / replicas of files are included in this value. | |
HDFS Space Remaining | Remaining potentially free space across HDFS. | |
Metrics | Number of Regions | Number of regions across the cluster. |
Balancer Enabled | Balancer is enabled or disabled for the source database. | |
Load Average | Average number of regions per RegionServer. Naïve computation as reported by the | |
Data Collection Date | Date on which the database scan was run. | |
mQE Version | Version of the Query Definitions file that was used by the mMC to collect the data. | |
mMC Version | Version of the migVisor Metadata Collector used to run the scan. |
MongoDB may be deployed in three different topologies: Replica Set, Sharded Cluster, and Standalone.
The parameters available under each of these detected topologies differ based on the characteristics and availability of information for each topology.
Replica Set
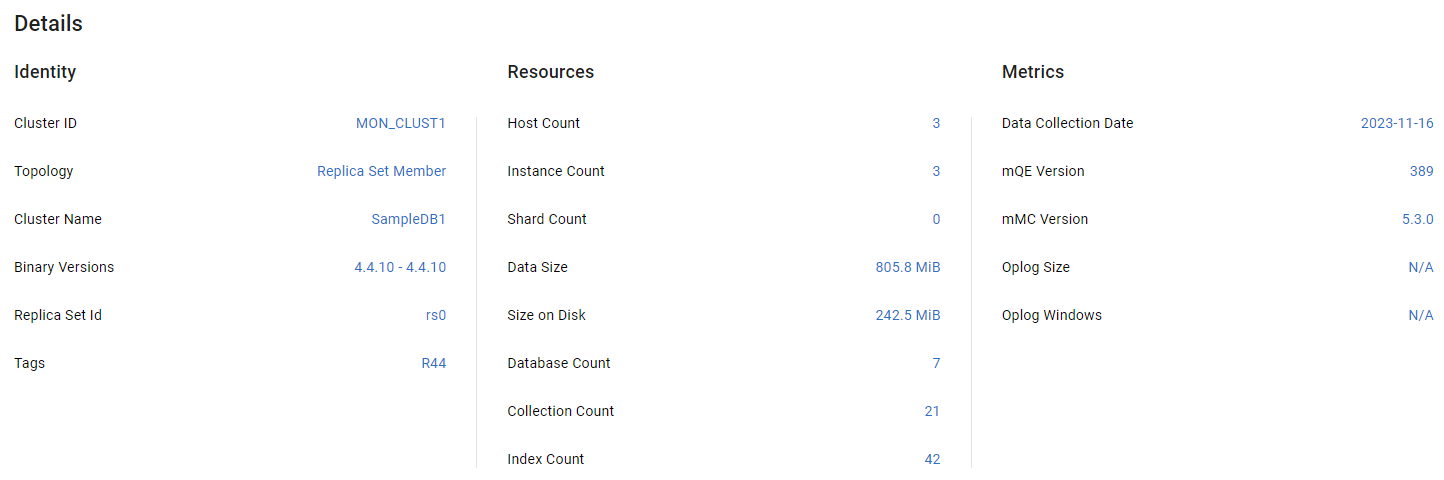
The parameters shown for a MongoDB Replica Set are:
Area | Parameter | Description |
|---|---|---|
Identity | Cluster ID | Cluster unique identifier. |
Topology | Deployment topology. “Replica Set” for Replica Sets. | |
Cluster Name | User-defined cluster name provided during the scan. | |
Binary Versions |
| |
Replica Set Id | Id of this Replica Set. | |
Tags | Any custom tags assigned to this source during scan. | |
Resources | Host Count | Number of unique hosts on which the Replica Set is deployed. |
Instance Count | Number of | |
Shard Count | Not applicable for Replica Sets. | |
Data Size | Total size of data stored by MongoDB. | |
Size on Disk | Total size of (compressed) data in files stored on disk by MongoDB. | |
Database Count | Number of user-defined databases. | |
Collection Count | Number of user-defined collections. | |
Index Count | Number of indexes across all user-defined collections. | |
Metrics | Data Collection Date | Date on which the database scan was run. |
mQE Version | Version of the Query Definitions file that was used by the mMC to collect the data. | |
mMC Version | Version of the migVisor Metadata Collector used to run the scan. | |
Oplog Size | Size (bytes) of the oplog. | |
Oplog Windows | Current oplog window in terms of time. This measures the difference between the oldest and the newest oplog entry. |
Sharded Cluster
.png?inst-v=5eec7e65-538b-46a5-8e43-a091d945528e)
MongoDB parameters for the Sharded deployment topology
The parameters shown for a MongoDB Sharded Cluster are:
Area | Parameter | Description |
|---|---|---|
Identity | Cluster ID | Cluster unique identifier. |
Topology | Deployment topology. “Sharded” for sharded clusters. | |
Cluster Name | User-defined cluster name provided during the scan. | |
Balancer Enabled | Balancer is enabled or disabled for the source database. | |
Binary Versions |
| |
Tag/Region Aware Sharding | Tag/Region aware sharding detection status. | |
Tags | Any custom tags assigned to this source during scan. | |
Resources | Host Count | Number of unique hosts on which |
Instance Count | Number of | |
Shard Count | Number of shards in this cluster. | |
Data Size | Total size of data stored by MongoDB across all primary members. This effectively is the size of data stored in all user-defined collections and of non-user-defined collections that are located in user-defined databases. | |
Size on Disk | Total size of (compressed) data in files stored on disk by MongoDB across all primary members. | |
Database Count | Number of user-defined databases. | |
Collection Count | Number of user-defined collections. | |
Index Count | Number of indexes across all user-defined collections. | |
Metrics | Data Collection Date | Date on which the database scan was run. |
mQE Version | Version of the Query Definitions file that was used by the mMC to collect the data. | |
mMC Version | Version of the migVisor Metadata Collector used to run the scan. | |
Oplog Size | Size (bytes) of the oplog. | |
Oplog Windows | Current oplog window in terms of time. This measures the difference between the oldest and the newest oplog entry. |
Standalone
In the standalone topology, there is only one mongod process.
If there is a single instance is configured as a single-member Replica Set, then it will show up as a Replica Set, not a Standalone.
.png?inst-v=5eec7e65-538b-46a5-8e43-a091d945528e)
MongoDB parameters for the Standalone deployment topology
The parameters shown for a MongoDB Standalone server are:
Area | Parameter | Description |
|---|---|---|
Identity | Cluster ID | Cluster unique identifier. |
Topology | Deployment topology. “Standalone” for stand-alone clusters. | |
Cluster Name | User-defined cluster name provided during the scan. | |
Binary Versions |
| |
Tags | Any custom tags assigned to this source during scan. | |
Resources | Data Size | Total size of data stored by MongoDB. |
Size on Disk | Total size of (compressed) data in files stored on disk by MongoDB. | |
Database Count | Number of user-defined databases. | |
Collection Count | Number of user-defined collections. | |
Index Count | Number of indexes across all user-defined collections. | |
Metrics | Data Collection Date | Date on which the database scan was run. |
mQE Version | Version of the Query Definitions file that was used by the mMC to collect the data. | |
mMC Version | Version of the migVisor Metadata Collector used to run the scan. |
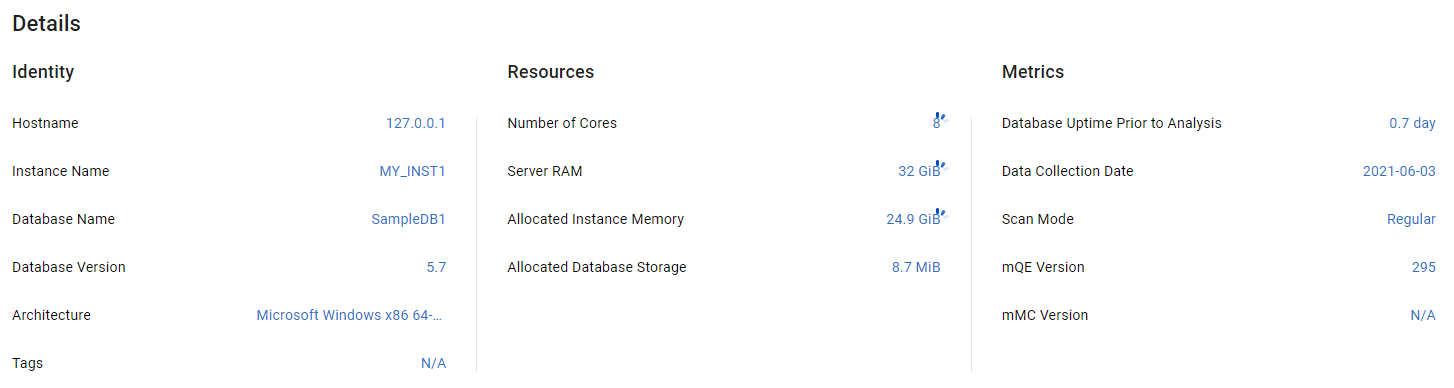
The parameters shown for MySQL are:
Area | Parameter | Description |
|---|---|---|
Identity | Hostname | Name or IP address of the server that hosts the source database. |
Instance Name | Name of the database instance. | |
Database Name | Name of the source database. | |
Database Version | Version of the source database. | |
Architecture | OS architecture of the host on which the database is running. | |
Tags | Any custom tags assigned to this source during scan. | |
Resources | Number of Cores | Number of virtual CPU cores. This number is based on various parameters gathered from system views, such as Prior to MySQL 5.6, |
Server RAM | Server memory available on the host where the DB is running. Our calculations take into account different parameters, derived from system views, such as Once we get an estimation based on these parameters, 30% is added as a buffer. | |
Allocated Instance Memory | Server memory allocated for the database. This number is based on various parameters gathered from system views, such as | |
Allocated Database Storage | Disk space used by the database data files. | |
Metrics | Database Uptime Prior to Analysis | Number of days the database was running since it was last restarted. |
Data Collection Date | Date on which the database scan was run. | |
Scan Mode | Scan mode used in mMC: Extended or Regular. | |
mQE Version | Version of the Query Definitions file that was used by the mMC to collect the data. | |
mMC Version | Version of the migVisor Metadata Collector used to run the scan. |
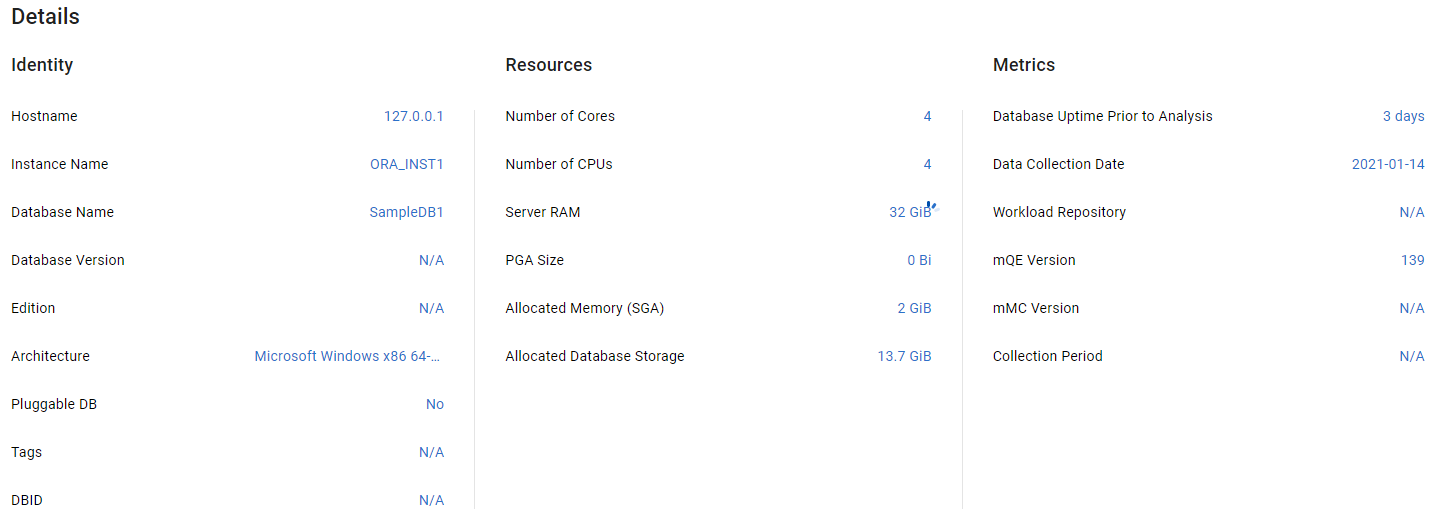
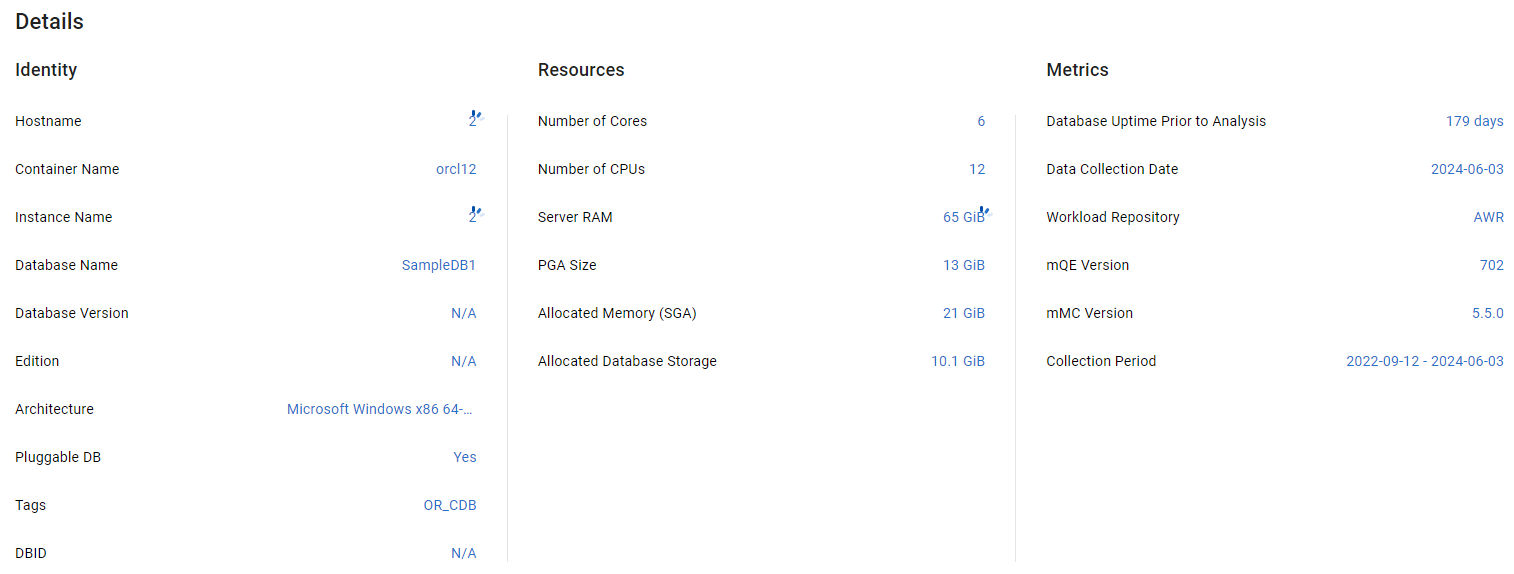
The parameters shown for Oracle are:
Area | Parameter | Description |
|---|---|---|
Identity | Hostname | Name or IP address of the server that hosts the source database. |
Container Name | Name of the Oracle CDB. Available for pluggable databases only. | |
Instance Name | Name of the database instance. | |
Database Name | Name of the source database. | |
Database Version | Version of the source database. | |
Edition | Name of the database edition. | |
Architecture | OS architecture of the host on which the database is running. Displays (Physical) or (Virtual) if configured in Source Management. | |
Pluggable DB | Indication of whether the database is pluggable (PDB). | |
Tags | Any custom tags assigned to this source during scan. | |
DBID | Unique identifier assigned to the database instance at creation time to distinguish between different databases in the cluster or on the same server. | |
Resources | Number of Cores | Count of virtual CPU cores. Specifies the number of CPU threads available for the instance. Derived from the CPU_COUNT setting in the V$PARAMETER view. |
Number of CPUs | Count of CPUs. | |
Server RAM | Server memory available on the host where the database is running. Specifies the physical memory in GB available on the server. Derived from the PHYSICAL_MEMORY_BYTES statistic metric in the V$OSSTAT view. | |
PGA size | Amount of server memory allocated for the database in addition to SGA. This memory contains session-dependent variables required by a dedicated or shared server process. | |
Allocated Memory (SGA) | Server memory allocated for the database. This read/write memory area along with the background processes form a database instance. | |
Allocated Database Storage | Disk space used by the database data files. | |
Metrics | Database Uptime Prior to Analysis | Number of days the database was running since it was last restarted. |
Data Collection Date | Date on which the database scan was run. | |
Workload Repository | Type of the repository selected for the database scan: AWR, Statspack, or Dynamic Views. | |
mQE Version | Version of the Query Definitions file that was used by the mMC to collect the data. | |
mMC Version | Version of the migVisor Metadata Collector used to run the scan. | |
Collection Period | Metadata collection period configured in mMC Preferences. When selecting Dynamic Views as a workload repository, the Scan Duration value is used as the collection period. |
The parameters shown for Oracle RAC are:
Area | Parameter | Description |
|---|---|---|
Identity | Hostname | Count of servers. |
Container Name | Name of the Oracle CDB. Available for pluggable databases only. | |
Instance Name | Count of instances. | |
Database Name | Name of the source database. | |
Database Version | Version of the source database. | |
Edition | Name of the database edition. | |
Architecture | OS architecture of the host on which the database is running. Displays (Physical) or (Virtual) if configured in Source Management. | |
Pluggable DB | Indication of whether the database is pluggable (PDB). | |
Tags | Any custom tags assigned to this source during scan. | |
DBID | Unique identifier assigned to the database instance at creation time to distinguish between different databases in the cluster or on the same server. | |
Resources | Number of Cores | Aggregated count of virtual CPU cores at the cluster level. |
Number of CPUs | Aggregated count of CPUs at the cluster level. | |
Server RAM | Sum of the server RAM from all instances. | |
PGA Size | Sum of the PGA size from all instances. | |
Allocated Memory (SGA) | Sum of the allocated memory (SGA) from all instances. | |
Allocated Database Storage | Disk space used by the database data files. | |
Metrics | Database Uptime Prior to Analysis | Sum of Uptime Prior to Analysis from all instances. |
Data Collection Date | Date on which the database scan was run. | |
Workload Repository | Repository type selected for the database scan: AWR, Statspack, or Dynamic Views. | |
mQE Version | Version of the Query Definitions file that was used by the mMC to collect the data. | |
mMC Version | Version of the migVisor Metadata Collector used to run the scan. | |
Collection Period | Metadata collection period configured in mMC Preferences. When selecting Dynamic Views as a workload repository, the Scan Duration value is used as the collection period. |
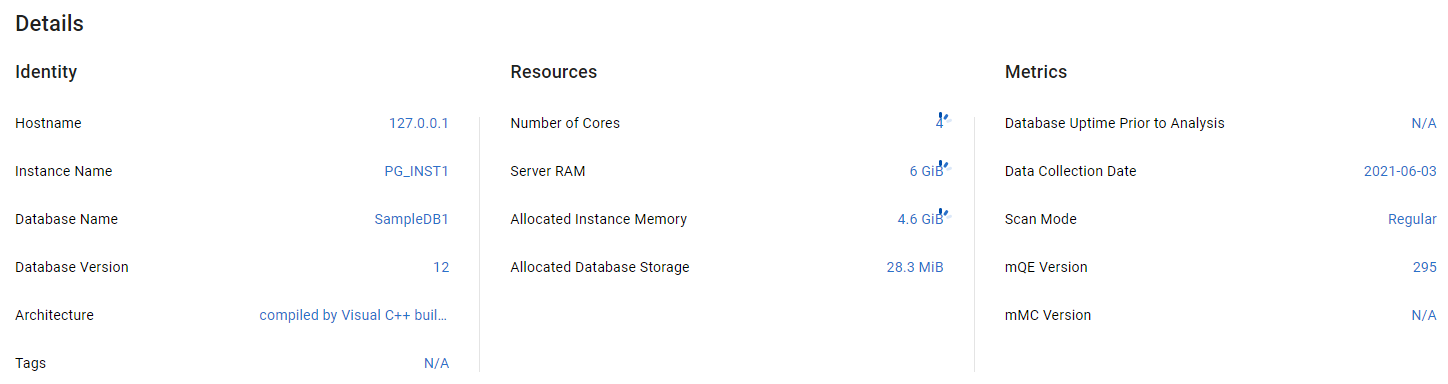
The parameters shown for PostgreSQL are:
Area | Parameter | Description |
|---|---|---|
Identity | Hostname | Name or IP address of the server that hosts the source database. |
Instance Name | Name of the database instance. | |
Database Name | Name of the source database. | |
Database Version | Version of the source database. | |
Architecture | OS architecture of the host on which the database is running. | |
Tags | Any custom tags assigned to this source during scan. | |
Resources | Number of Cores | Number of virtual CPU cores. This number is based on various parameters gathered from system views, such as |
Server RAM | Server memory available on the host on which the database is running. This number is based on various parameters gathered from system views, such as This calculated size is padded 30% as a buffer, in order to support sizing for real-world requirements. Prior to PostgreSQL 8.1, | |
Allocated Instance memory | Server memory allocated for the database. This number is based on various parameters gathered from system views, such as Prior to PostgreSQL 8.1, | |
Allocated Database Storage | Disk space used by the database data files. | |
Metrics | Database Uptime Prior to Analysis | Number of days the database was running since it was last restarted. |
Data Collection Date | Date on which the database scan was run. | |
Scan Mode | Scan mode used in mMC: Extended or Regular. | |
mQE Version | Version of the Query Definitions file that was used by the mMC to collect the data. | |
mMC Version | Version of the migVisor Metadata Collector used to run the scan. |
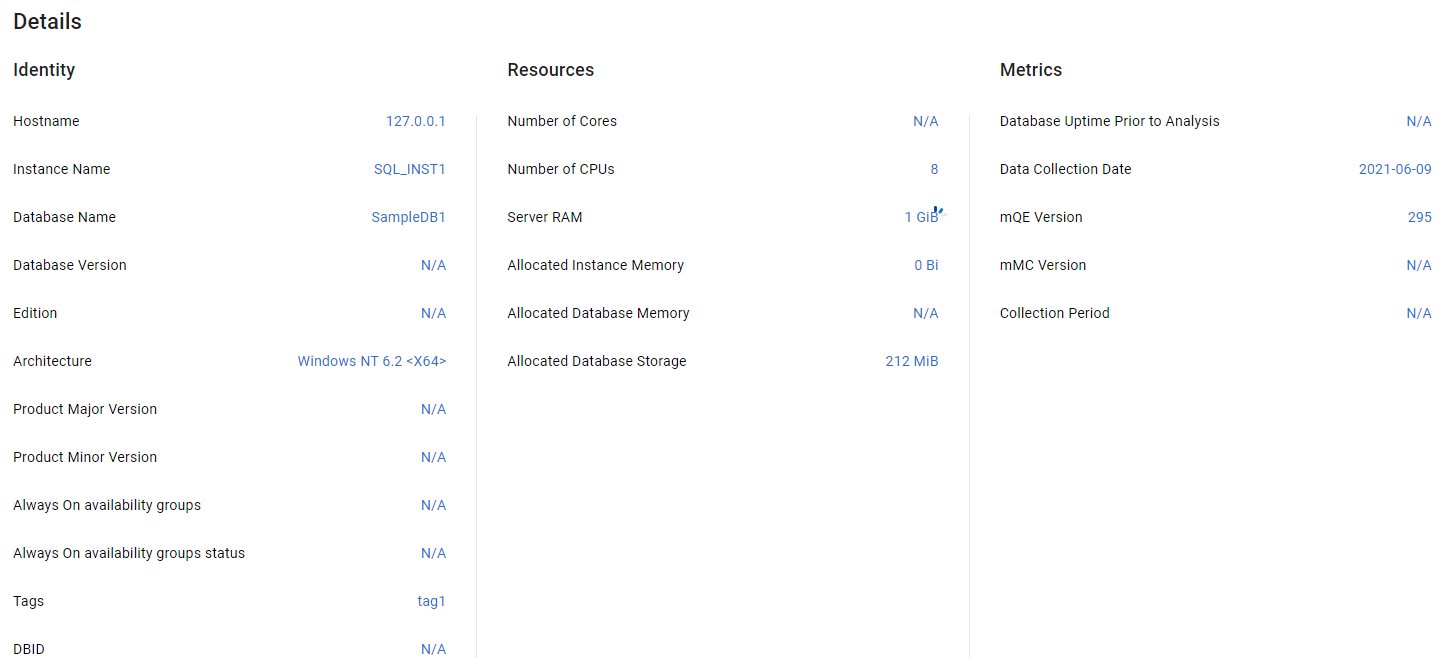
The parameters shown for SQL Server are:
Area | Parameter | Description |
|---|---|---|
Identity | Hostname | Name or IP address of the server that hosts the source database. |
Instance Name | Name of the database instance. | |
Database Name | Name of the source database. | |
Database Version | Version of the source database. | |
Edition | Name of the database edition. | |
Architecture | OS architecture of the host on which the database is running. Displays (Physical) or (Virtual). | |
Product Major Version | Major version portion of the ‘ProductVersion’ property. | |
Product Minor Version | Minor version portion of the ‘ProductVersion’ property. | |
Always On availability groups | Always On availability is enabled or disabled for the source database. | |
Always On availability groups status | Always On's current runtime status (running, not started, or failed). | |
Tags | Any custom tags assigned to this source during scan. | |
DBID | Unique identifier assigned to each database at creation time to distinguish between different databases in the instance. | |
Resources | Number of Cores | Number of virtual CPU cores. Specifies the number of CPU threads available for the database. Derived from the CPU_COUNT setting in the dm_os_sys_info view. |
Number of CPUs | Count of CPUs. | |
Server RAM | Server memory available on the host where the database is running. Specifies the physical memory in GB available on the server. Derived from the total_physical_memory_kb statistic metric in the dm_os_sys_memory view. | |
Allocated Instance Memory | Server memory allocated for the instance. | |
Allocated Database Memory | Server memory allocated for the database. | |
Allocated Database Storage | Disk space used by the database data files. | |
Metrics | Database Uptime Prior to Analysis | Number of days the database was running since it was last restarted. |
Data Collection Date | Date on which the database scan was run. | |
mQE Version | Version of the Query Definitions file that was used by the mMC to collect the data. | |
mMC Version | Version of the migVisor Metadata Collector used to run the scan. | |
Collection Period | Scan duration that was configured in mMC for the database scan if Extended scan was enabled. |
Banner (Oracle, SQL Server)
The Banner section highlights the database key identity characteristics, such as type, edition, version, and security patch level.
The section is displayed when the relevant information is available.
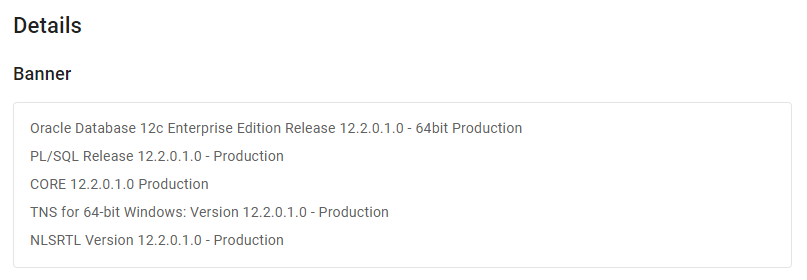
The Banner section