Source Target Sizing
The Target Sizing section shows information about the source which can be used to choose the sizing of the target. Using information form the whole analysis and this section in particular can help in determining the size of a target to accommodate the current workloads.
.png?inst-v=4c6351f5-8955-40dc-adab-a0825b239b9a)
The Target Sizing section for MongoDB sources
The parameters in this section vary by source DB engine:
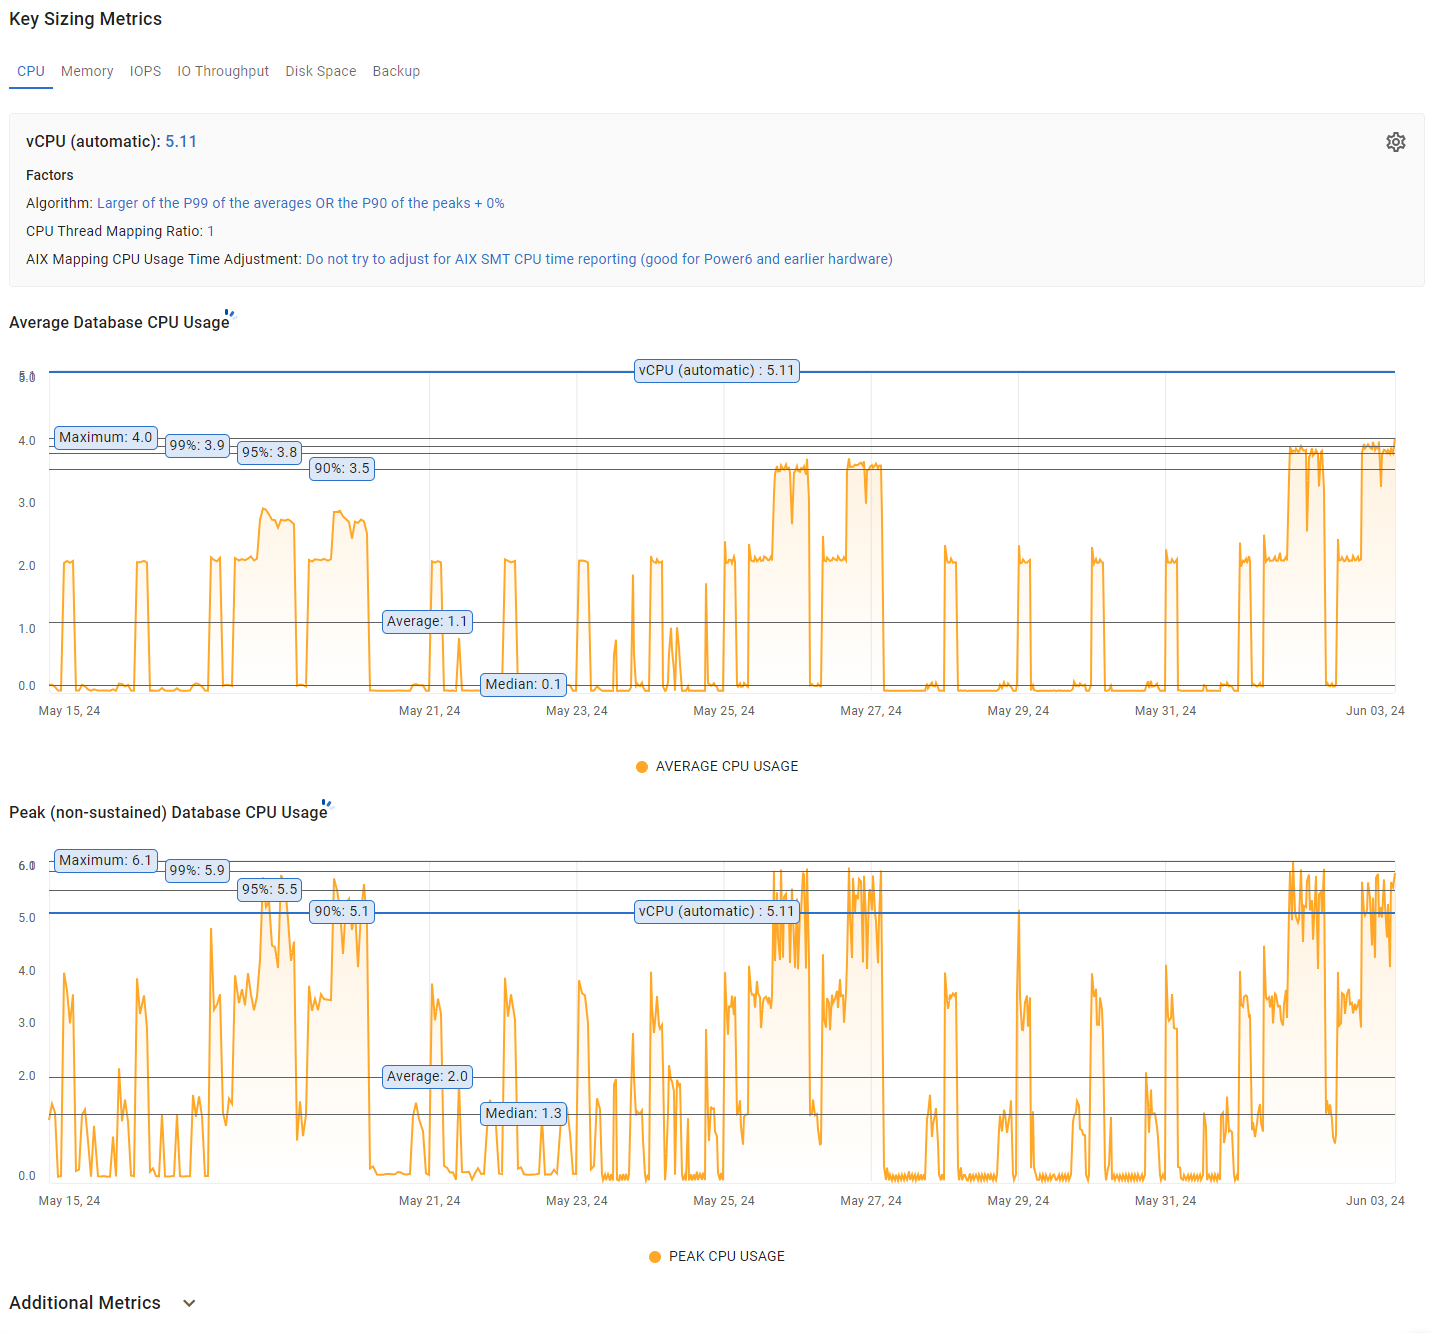
Key Sizing Metrics
Applicable to Oracle and SQL Server only.
The Key Sizing Metrics section contains graphs that visualize the workload and target sizing information collected for the database source over time. The collected information is placed on a timeline, which allows zooming in/out to focus on specific time periods.
When applicable, graphs are complimented with the calculated value summary box providing the following information:
Key sizing metric and its calculated value, including an indicator whether it was calculated automatically or set manually.
Selected algorithm.
Any additional configured parameters, if applicable.
A cog icon in the upper-right corner of the calculated value summary box opens the Target Sizing section in Source Management.
When applicable, the following reference lines are placed on the graphs:
Maximum – the highest occurrence of all values.
99%, 95%, and 90% – the percentage of data points that are accounted for.
Average – the calculated average of all values.
Median – the value in the middle of the range found after sorting all values in ascending order.
Hovering over the timeline at any point highlights the value for the corresponding snapshot and the date for which the data was collected.
The CPU Usage graphs for an Oracle database
The graphs represent the data for the focus period configured in Source Management. If changed, the graphs are updated respectively.
CPU
The CPU graphs display CPU utilization information over time.
AWR Repository
The following graphs are displayed:
Average Database CPU Usage – the average number of CPU threads used by the database during each snapshot time period.
Peak (non-sustained) Database CPU Usage – the peak number of CPU threads used by the database during each snapshot time period.
The Additional Metrics subsection contains the following graphs:
Comparison: Average CPU Usage, Database versus Entire Host – a comparison of the average number of CPU threads used for this database and the entire host.
Entire Host: Average CPU Usage – the average number of CPU threads used by the entire host during each snapshot time period.
Entire Host: Peak (non-sustained) CPU Usage – the peak number of CPU threads used by the entire host during each snapshot time period.
Statspack Repository
The following graph is displayed:
Peak (non-sustained) Database CPU Usage – the peak number of CPU threads used by the database during each snapshot time period.
Memory
The Memory graphs display memory allocation information over time.
AWR and Statspack Repositories
The following graph is displayed:
Memory Allocation – the combined allocated size in GB of the SGA and PGA.
IOPS
The IOPS graphs display data transfer rates information over time.
AWR Repository
The following graphs are displayed:
Average IOPS (IO Requests/second) – the average rate (Database IO Requests/second) during each snapshot time period.
Peak (non-sustained) IOPS (IO Requests/second) – the peak (non-sustained) rate (Database IO Requests/second) during each snapshot time period.
Statspack Repository
The following graph is displayed:
Peak (non-sustained) IOPS (IO Requests/second) – the peak (non-sustained) rate (Database IO Requests/second) during each snapshot time period.
IO Throughput
The IO Throughput graphs display data transfer rates information over time.
AWR Repository
The following graphs are displayed:
Average Throughput (MB/s) – the average IO Throughput rate (MB/s) during each snapshot time period.
Peak (non-sustained) Throughput (MB/s) – the peak (non-sustained) IO Throughput rate (MB/s) during each snapshot time period.
Statspack Repository
The following graph is displayed:
Peak (non-sustained) Throughput (MB/s) – the peak (non-sustained) IO throughput rate (MB/s) during each snapshot time period.
Disk Space
The Disk Space graphs display disk space utilization and trends within the database.
AWR Repository
The following graph is displayed:
Disk Space Metrics (GiB) over Time – the total allocated space of the non-TEMP tablespaces for the database.
Backup
The Backup graphs display backup-related information over time.
AWR Repository
The following graphs are displayed:
Redo Generation Rate (MB/s) over Time – the average redo generation rate (MB/s) during each snapshot time period.
Physical Write Rate (MB/s) over Time – the average write rate (MB/s) during each snapshot time period.
Each graph represents the data for the focus period set in Source Management. If changed, the graphs are updated respectively.
For Oracle RAC databases, graphs are displayed for the entire cluster. Instance-level graphs are found on the Single Instance page.