Single Application
The Single Application page contains data specific to a selected application.
Given no target is selected, the Single Application page displays generic analysis metrics, mostly focused on the Modernization Complexity aspects of the analysis.
Header
The header contains the identity information of the current application. It also includes the option to select a migration target for a source associated with the application and links to the main sections of the page.
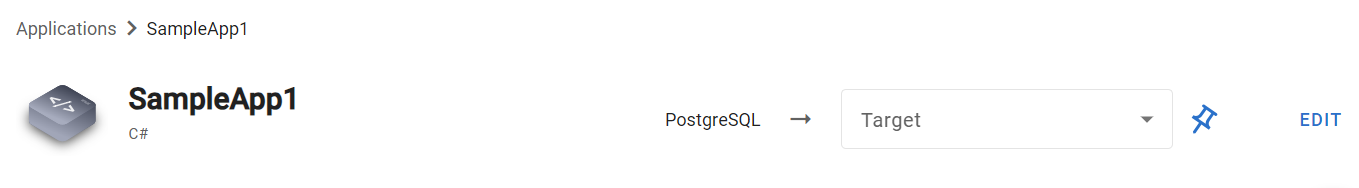
The Single Application page header
The identity information includes the application name, programming language, and its version.
The target selection section displays the DB engine of the source the application is associated with. The Target dropdown lists the available migration targets for the source.
The migration target affects the estimated complexity.
To preselect the optimal target each time you open the page, press the pin icon. To cancel the previously pinned source-target pair, press the unpin icon.
Overview
The Overview section contains a graphical representation of the application’s overall complexity and features that contribute to it—their number and complexity impact.

The Overview section
Overall Complexity
The Overall Complexity subsection shows you a gauge meter that contains three colored segments corresponding to the overall complexity level: green for Low, yellow for Medium, and red for High. The arrow of the gauge points to the determined overall complexity level for this application concerning the chosen target.

The Overall Complexity subsection
The overall complexity of the application is affected by two components:
Modernization Complexity determines if the application needs refactoring and how difficult it will be to refactor it. It is based on the data collected from the application’s code analysis performed by mMC.
Migration Complexity determines the complexity of changing the application from using the current associated source or database, to the selected target at the top of the page.
Each complexity is shown by a linear gauge split into three sections specifying the levels of complexity.
Findings per Impact Level
Both the migration and modernization complexities are determined by features collected from the application and the associated source. In the Findings per Impact Level subsection, the features are split by their complexity impact into three groups represented by boxes named and colored in accordance with the impact level of features they contain. Each box shows the number of features of the corresponding complexity impact.

The Findings per Impact Level subsection
Summary
The Summary text describes the application’s overall complexity specifying its complexity score, and the level of work to be performed to refactor the application.

The Summary subsection
Details
The Details section lists key findings collected for any application regardless of its programming language.
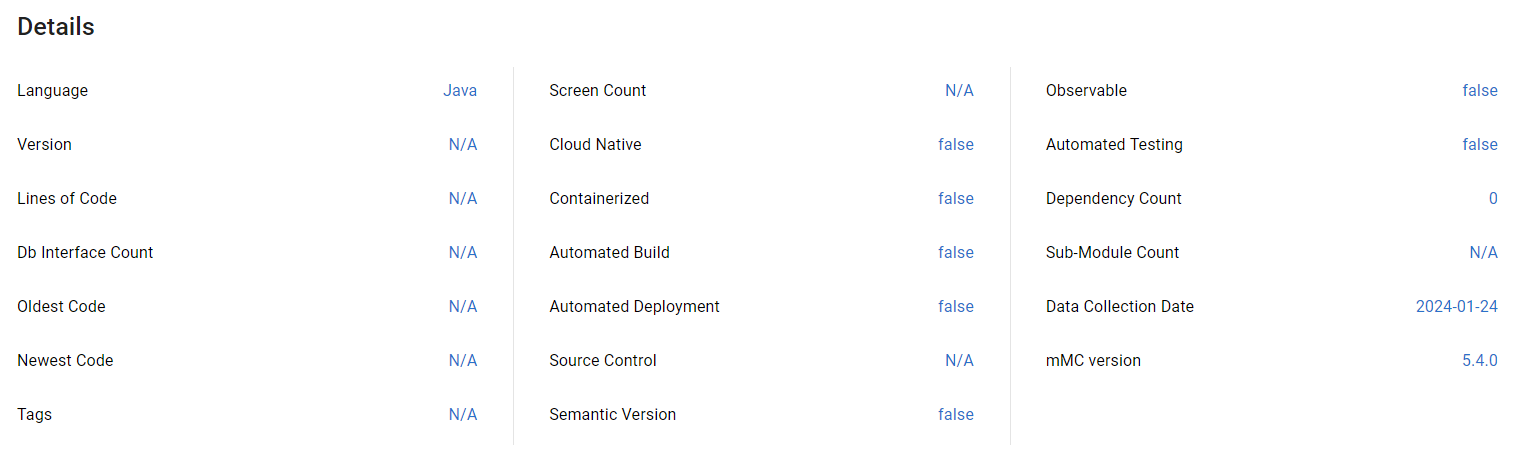
The Details section
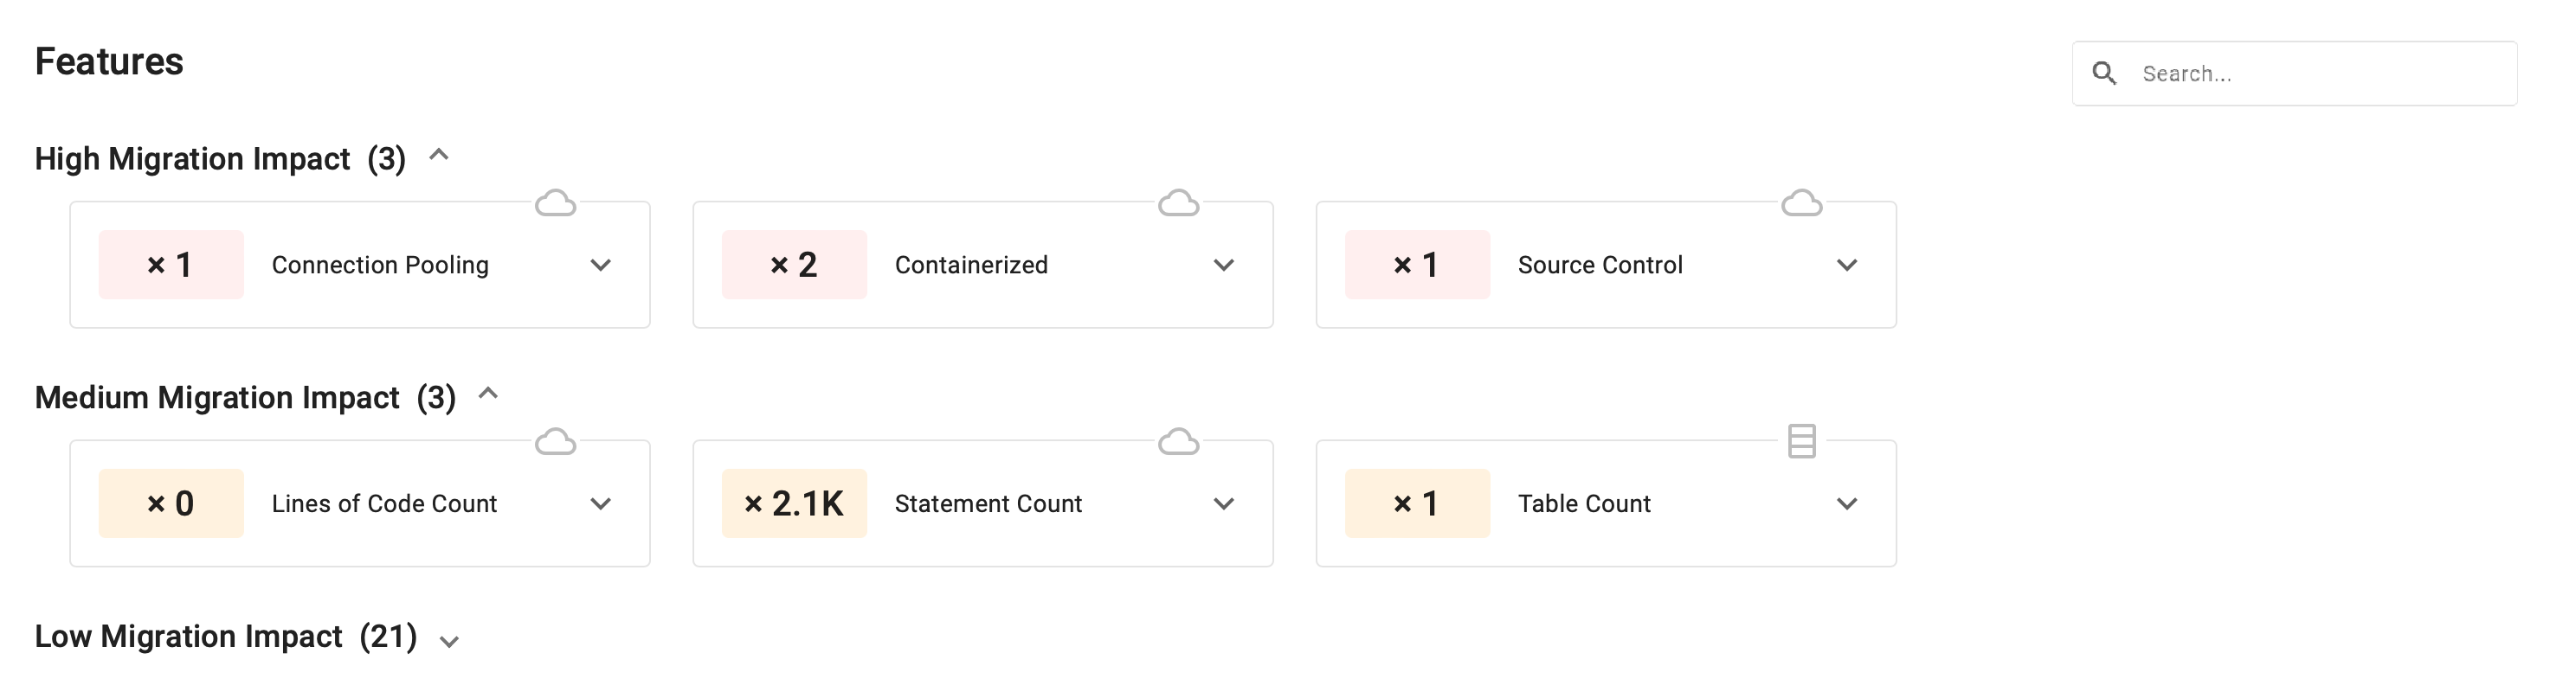
Features
The Features section lists features that affect the migration and modernization complexity of the application so that you could learn more details about each feature’s impact.
Complexity Level Subsections
The section is split into subsections in accordance with the impact the features have on the application’s migration and modernization complexity.
The number in parenthesis shows the number of features of each complexity level.
The complexity level subsections are expandable lists, expanded by default. To close/open them, press the chevron icon that follows the feature number in parenthesis.
The Complexity Level subsections
Feature Tile
The Features section displays features as expandable tiles. When collapsed, the tiles contain the following items:
Complexity affinity icon. It shows if the feature is associated with the modernization complexity (cloud icon) or the migration complexity (database icon). Only one affinity link is possible.
Instance-counter indicator. A rectangle that shows the number of instances or contributing items the feature score is based on. Colored according to the complexity level: green for Low, yellow for Medium, and red for High.
Name of the feature.
(Optional) Possible false-positive indicator. If a feature tile has a Possible false-positive icon inside it, the detected feature could have been detected by mistake and should be looked at further by the analysis team.


To get more details about the feature, press the down-chevron icon on the tile to expand it.
After expanding a tile, two additional tabs become available: Info and Location. The Info tab is shown by default.
The Info tab contains the description of the feature. It can:
Propose some ways to mitigate the feature’s impact on the complexity.
Describe cases when the detected feature can be ignored.

The Info tab for the Statement Count feature
The Location tab shows the tree of expandable nodes with the detected source locations and values the feature is based on.
The counter in parentheses is the number of locations items (files and offset typically) under that label (child counter).

The Location tab for the Containerized feature
Filter Features
To find particular features by their names, use the Search field in the upper-right corner of the Features section. The filter will present features split between various complexity-level subsections.
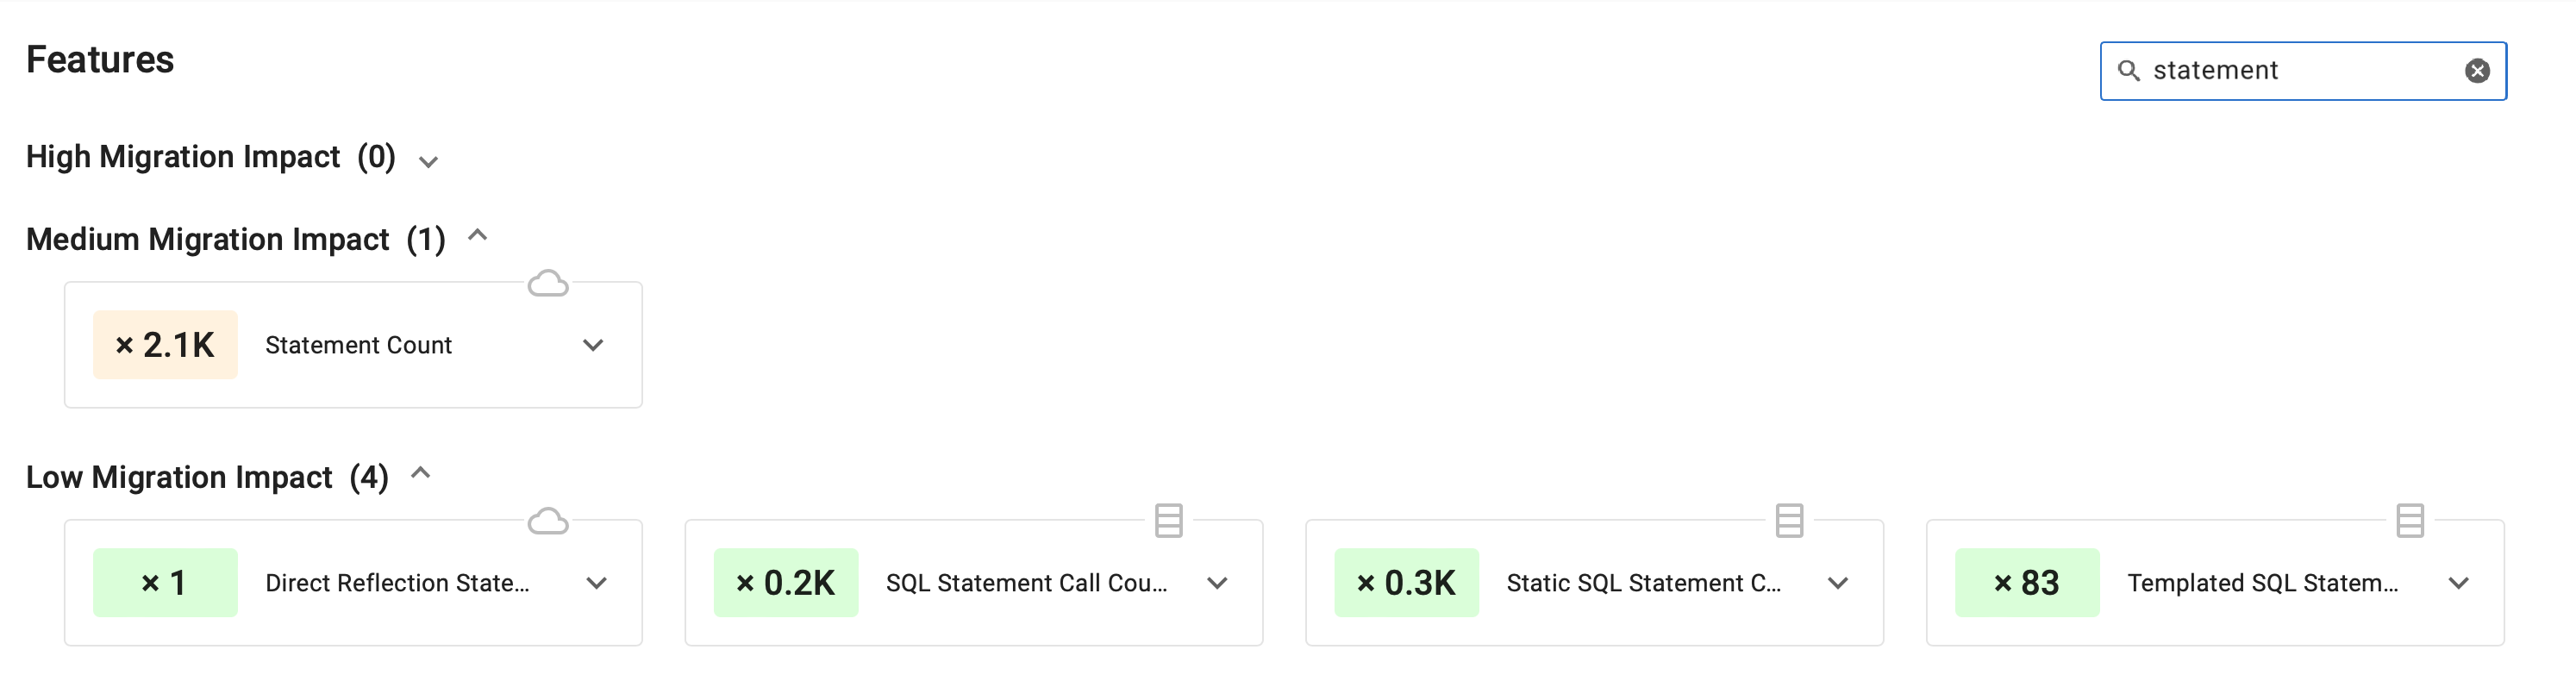
Filtered features
Associated Databases
The Associated Databases page shows the sources the application interacts with. It helps to understand the database dependencies the application has.
The associated databases include connected databases determined by identifying drivers during the scanning by mMC.
The Connected Databases subsection contains a table listing source DB engines detected by mMC during the application scan, primarily by the driver(s) the application is using. It has three columns:
DB Engine – contains the generic source technology name (e.g. Oracle, MySQL, PostgreSQL, SQL Server, etc.)
Driver – column contains the driver's name or class (e.g. oracle.jdbc.OracleDriver).
Version – contains the driver's version.

The Associated Databases section