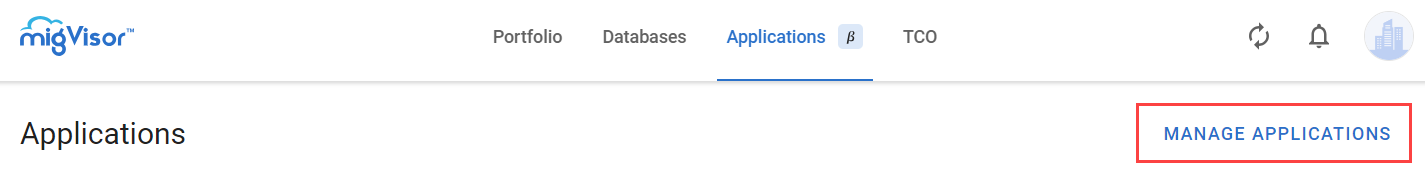
Applications
The Applications page shows applications associated with sources that were uploaded or declared under the current mConsole account.
To manage applications—exclude them or their features from migration analysis or adjust other settings—press Manage Applications. The link navigates to Applications Management.
Application Filters
The Filters section is located at the top of the Applications page. Filtering enables selecting applications for discovery and analysis.

By default, the filter includes the following fields:
Language. Filters the applications by their programming language. To select languages from the list, select the appropriate checkboxes, or apply the select all/deselect all or Search options.
 It is possible to select only a language without a version to get the list of all applications based on the selected language version. migVisor supports Java and C# languages.
DB Engine. Filters the applications by their associated sources' DB engines. To select sources from the list, select the appropriate checkboxes, or apply the select all/deselect all or Search options.
Creation Mode. Filters the applications by the way they appeared on mConsole. It is possible to select created applications as Scanned or Declared:
Scanned shows applications that were created by uploading scans from mMC. They will be shown even if later a user edited them using the Edit Application functionality.
Declared shows applications that were created by filling in a blank Edit Application form. These applications are Declared, meaning the user declared they exist, but did not scan them with mMC.
Enter information in two or more fields of the Filters section, it will show applications that match all the criteria.
The filtered applications are displayed in the Summary and Catalog sections (see below).
Press Clear Filter to reset all filter elements to their default states.
Summary of Applications
The Summary section provides a general overview of the filtered applications including their breakdown by programming languages, modern vs. legacy statuses, and migration complexity.
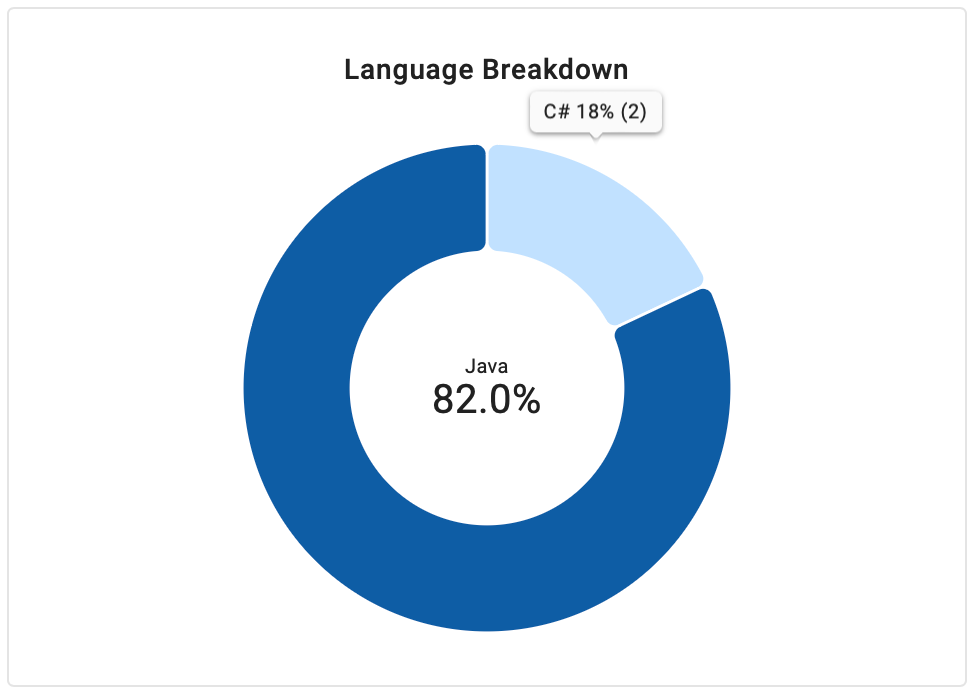
Language Breakdown Widget
The widget provides a comparative quantitative analysis of the available applications by their programming language. The widget is implemented in the form of a donut chart broken into segments, each one representing the share of applications associated with a specific language in the total number of available applications. To view a particular percentage, hover over a segment, and the percentage will be shown in the center of the chart. The segments grow clockwise from smaller to higher ones.
The segments are colored in different blue gradients based on the rule: the higher the percentage, the darker the color of the segment.
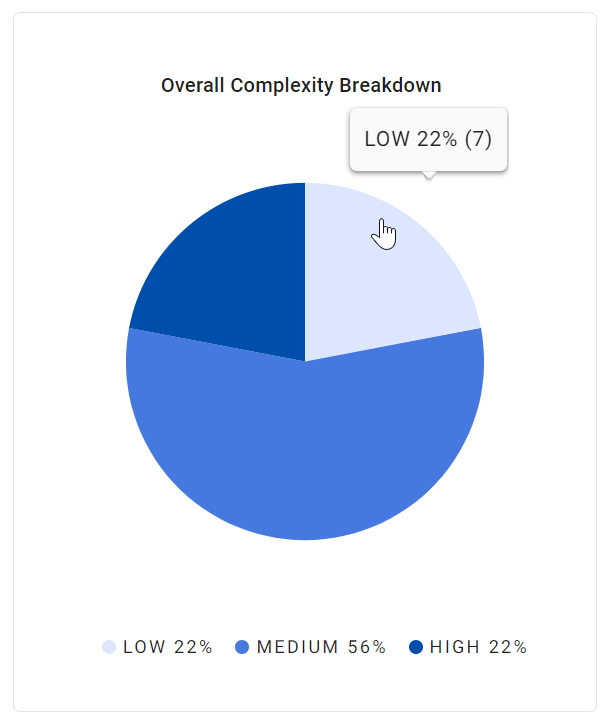
Overall Complexity Breakdown Widget
The widget shows migration complexities of the available applications as a pie chart split into three segments colored into different gradients of blue – light, medium, and dark – specifying low, medium, and high complexity respectively. Each segment shows the percentage of applications within the complexity level in the total number of available applications. The legend below the chart explains the colors of each complexity level and also presents their percentage.
Hover over a segment to see a tooltip with the exact number of sources that have a particular migration complexity level.
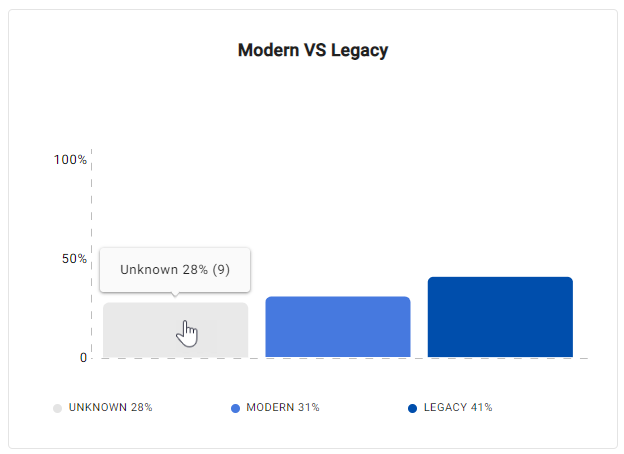
Modern vs. Legacy Applications Widget
The widget provides a comparative quantitative analysis of the available applications classified by their modernity types as: Modern, Legacy, or Unknown. The application quantities of each type are shown as a bar chart. Each bar represents the percentage of each type in the total number of applications. The legend below the chart shows the colors of each modernity type and also presents their percentage.
The modernity type is calculated by a special logical algorithm integrated into mConsole. The calculations are based on the analysis of special features found in the application’s code and the time the code was modified.
Hover over a bar to see a tooltip with the exact number of applications within that designation.
Catalog of Applications
Catalog lists applications that match the criteria set in the Filter section. It shows applications as a list of tiles. The tiles are collapsed by default. Pressing the chevron on the tile bottom can be used to expand or collapse an individual tile.
Application Tile
Each tile contains the following information items based on its view:
Item | Tile View |
|---|---|
Collapsed view:
| 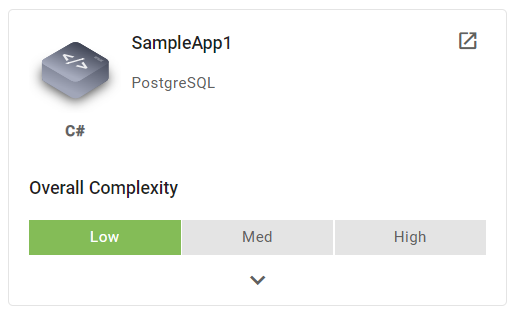 |
Expanded view adds the following items:
| 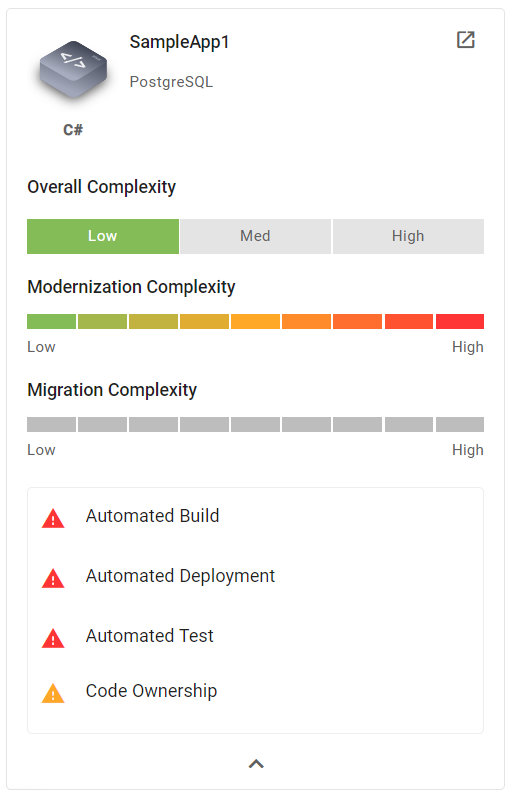 |
To see more details, open a Single Application page by pressing the expand icon in the upper-right corner of the tile.