Databases Analysis Widget
The Databases Analysis widget provides analysis of multiple sources at a glance, showing a summary of their migration complexities depending on the selected target cloud platform.
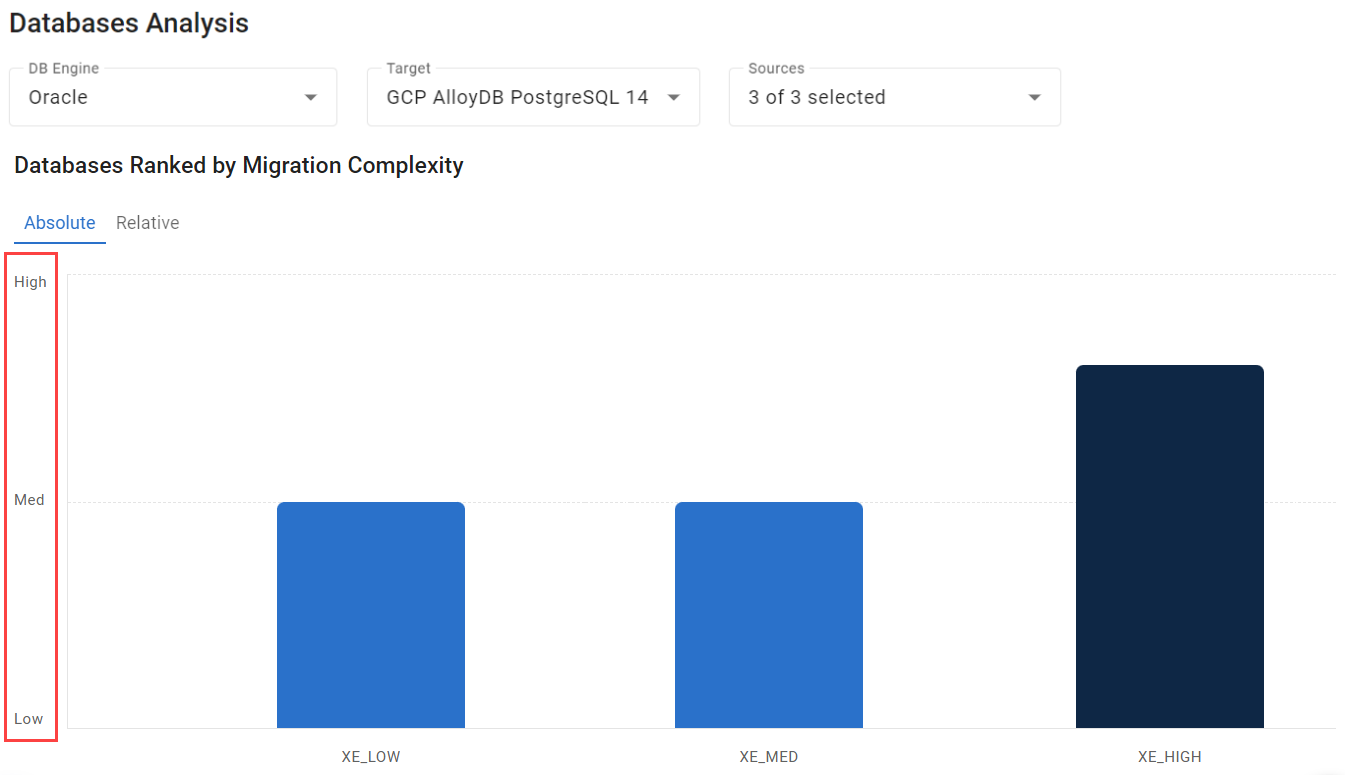
Source Filtering
A source and a target must be chosen before the summary analysis can be displayed.
In the sources filter, provide the following:
Select the DB Engine of the sources to analyze.
The filter lists DB engines without reference to their versions.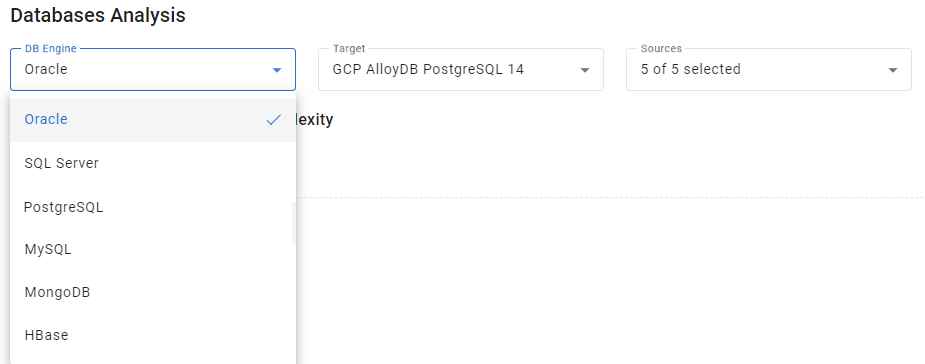
Select the Target for migration.
The filter lists all targets available for sources with the selected DB engine. The Target includes the cloud vendor, DB engine, and its version.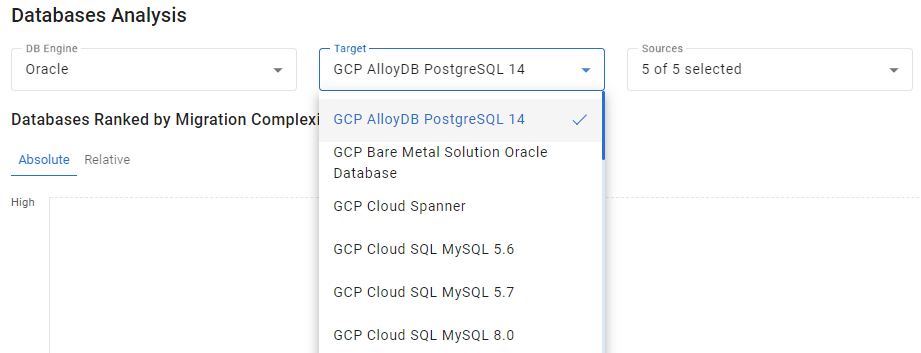
Optionally, select the Sources from the list.
All available sources are selected by default. You can search for particular sources by their hostnames, or use the Select all checkbox to analyze all available sources of the selected DB engine, or the Deselect all checkbox to cancel the selection.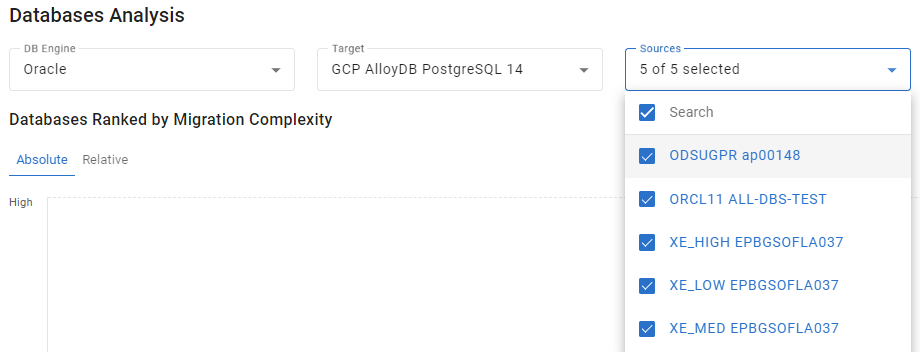
Migration Complexity Chart
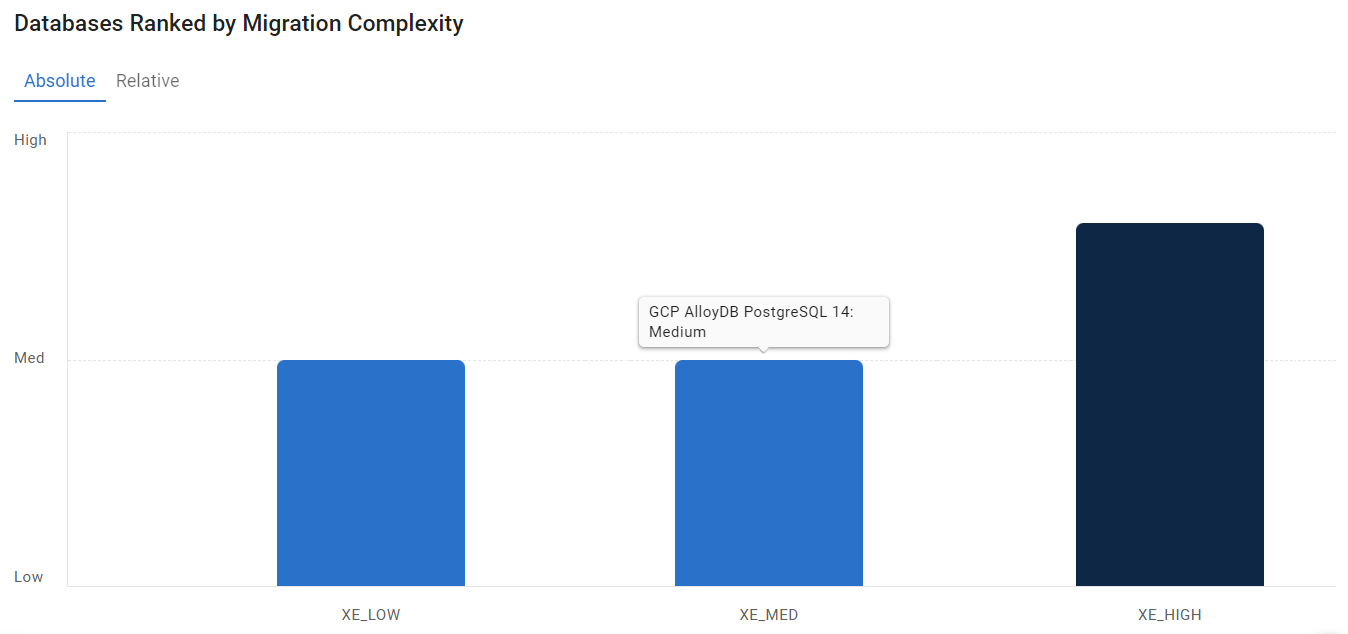
The selected sources will be displayed on the Databases Ranked by Migration Complexity chart below the filter. Each source is represented by a vertical bar of different height and color depending on its complexity as dark blue for high, blue for medium, light blue for low. The source names are specified under the respective bars.
Hover over a bar to view a summary of the source associated with this bar. The summary contains the target platform and the migration complexity.
Absolute and Relative Complexity
Migration complexity can be Absolute or Relative.
Absolute (Default)
Absolute complexity ranks sources as Low, Medium, and High. The absolute complexity score is calculated by a special formula based on the migration scores of features detected in a source and those of a migration target engine.
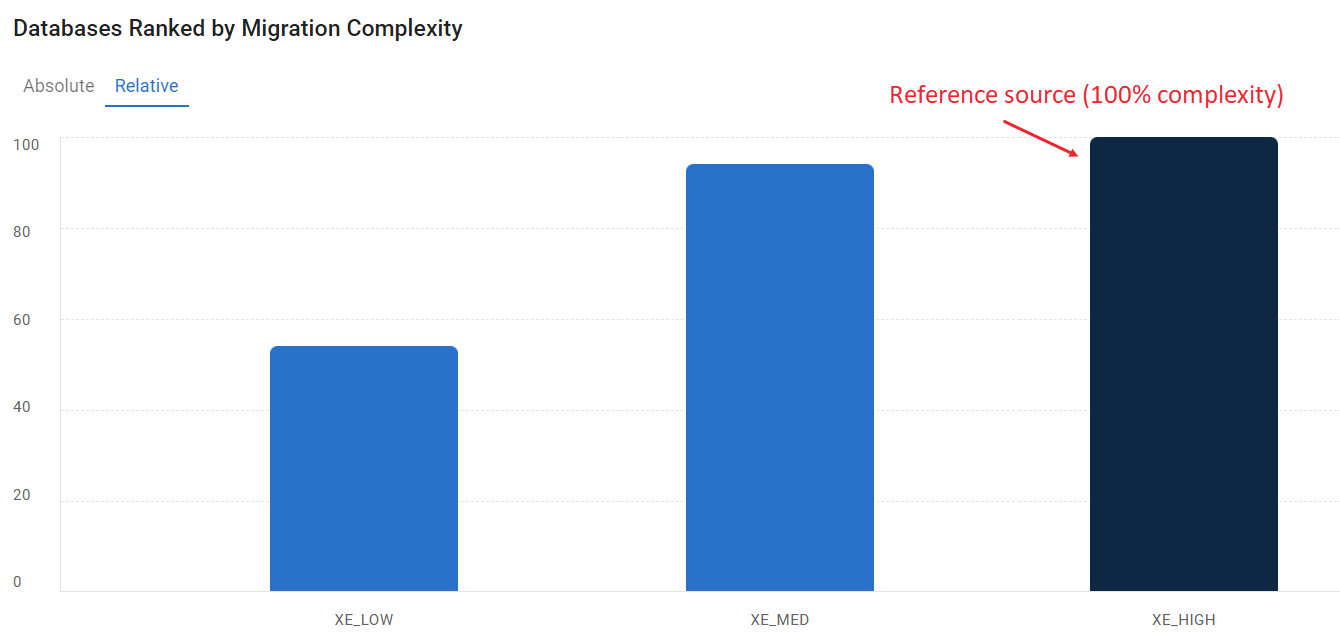
Relative
Relative complexity is a score in percent, where 100% belongs to a source with the highest absolute migration score – the reference source. The other selected sources are scored in percent compared to the reference source.
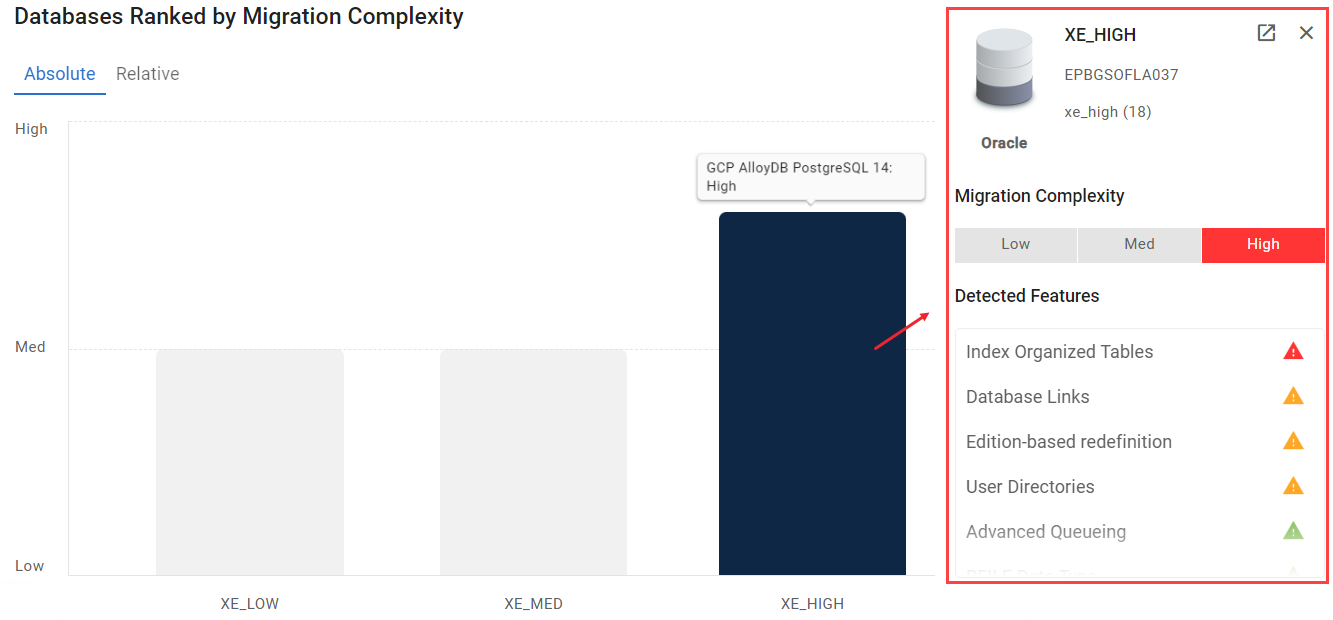
Source Tile
Press a source bar in the graph to open the summary tile of this particular source. The tile opens to the right of the graph reducing the graph size while open. The tile contains general information of the source, including:
Source icon showing the source DB engine and size.
Source DB Engine.
Source ID details: source name and version, instance name, and hostname.
Migration complexity: low, medium, or high.
Detected features.
The X button at the upper-right corner of a tile. Press it to close the tile.
Source Database and Size Representation
Each database in migVisor is represented by an icon and a label. The icon is designed as a three-stripe barrel which indicates the source DB engine type and size.
The data volume contained in a source is indicated by a number of colored stripes of the barrel:
One colored stripe indicates a small data volume.
Two colored stripes indicate a medium data volume.
Three colored stripes indicate a large data volume.
Small | Medium | Large |
|---|---|---|
 |  |  |
Sizes are defined individually for each DB engine source type:
DB Engine | Size | Start Range (GB) >= | End Range (GB) < |
|---|---|---|---|
HBase | SMALL | 0 | 1000 |
MEDIUM | 1000 | 20,000 | |
LARGE | 20,000 | ∞ | |
MongoDB | SMALL | 0 | 100 |
MEDIUM | 100 | 600 | |
LARGE | 600 | ∞ | |
|
The rating is applicable for standalone and replica-set clusters. Sharded clusters, regardless of data size, are considered Large. | |||
MySQL | SMALL | 0 | 50 |
MEDIUM | 50 | 200 | |
LARGE | 200 | ∞ | |
Oracle | SMALL | 0 – 200 | 200 |
MEDIUM | 200 – 600 | 600 | |
LARGE | 600 – ∞ | ∞ | |
PostgreSQL | SMALL | 0 | 100 |
MEDIUM | 100 | 250 | |
LARGE | 250 | ∞ | |
SQL Server | SMALL | 0 | 100 |
MEDIUM | 100 | 500 | |
LARGE | 500 | ∞ | |
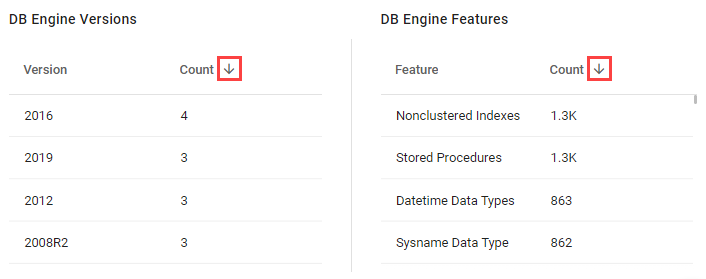
DB Engine Versions and Features
Below the chart, the summary tables list the numbers of all available DB Engine Versions and all DB Engine Features of the uploaded sources that match the criteria of the Databases Analysis Widget | Source-Filtering set earlier.
Each section has two columns: Version and Count, and Feature and Count. By default, versions and features are sorted by their count from highest to lowest.
Perform sorting by pressing the up/down arrows (ascending/descending sorting respectively).