[mMC GUI] Databases
The Databases tab contains the list of all database data sources that were added to mMC either manually or via importing a DB configuration file.
In the list, the data source icon varies depending on whether the data source is a database instance or a single database.
The data source icon has a pencil icon inside if any data source lacks the information required for scanning.

Database

Database Instance
Applicable for PostgreSQL, MySQL, and SQL Server.
Database List
The data source list is a table with the following columns:
For PostgreSQL, MySQL, and SQL Server sources, it is possible to save a data source as a database instance. To do so:
Add or edit a database data source.
On the Connection tab, select the Instance option in the Type drop-down list.
Provide the required information.
Press the Save button.
In an instance tile, the DB ID/SID column displays the number of databases at the time the data source was created, or the connection was tested last. If databases cannot be determined or have been excluded from the instance, the displayed number is 0. The number of databases may change according to the current state of the instance at the time of scanning.
The tags that have been added to an instance or a database in an instance are applied to all databases in the instance.
To expand all databases in an instance, press the chevron icon in the instance tile.
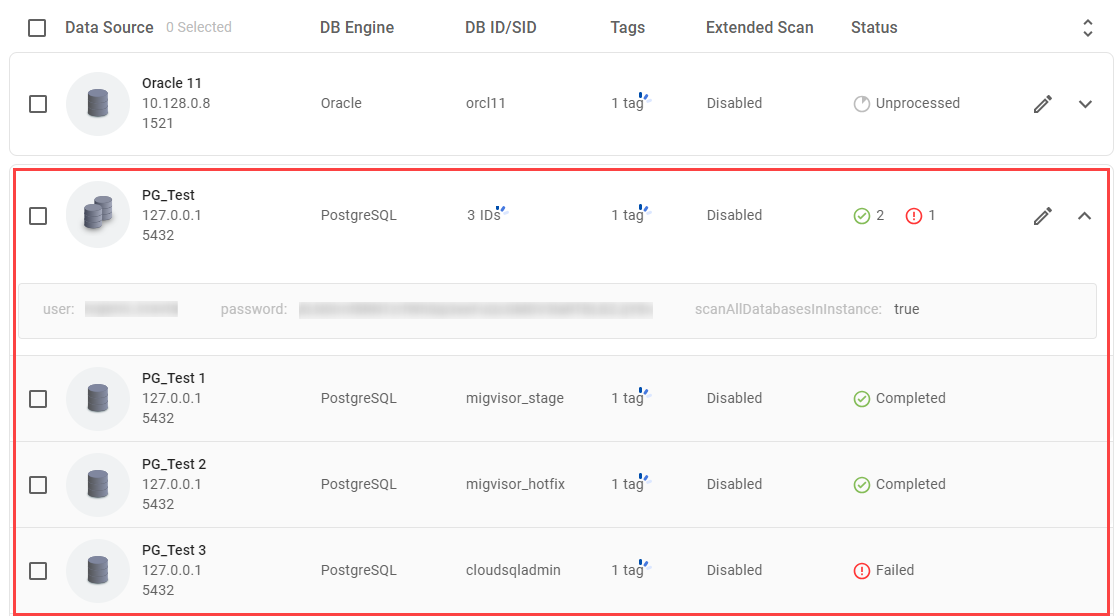
The Databases tab with an expanded instance
Statuses
Possible data source statuses are:
Unprocessed:
Data source was added but wasn’t scanned.
Data source was scanned but then was edited.
Data source scanning was canceled.
Connection was successfully tested but the data source wasn't scanned.
Processing:
Connection is being tested or the data source is being scanned.
Scan results are being saved locally or uploaded to mConsole.
Completed:
Data source was scanned, and scan results were successfully saved locally or uploaded to mConsole.
Сonnection in the “Completed” status was successfully tested.
Failed:
Errors occurred during the testing, scanning, saving, or uploading process.
Instance-level statuses:
The statuses of all databases are aggregated within an instance and are displayed with a count next to the icon for each status.
For an instance with all excluded databases in it, only the instance-related statuses are displayed at the instance level.
If the provided data source configuration is not sufficient for establishing a connection, no status is shown and the pencil icon is displayed on the data source icon.
Add Database Data Source Configuration
To add and configure a data source database configuration manually:
On the Databases tab, press the round + button in the lower-right corner.
In the dropdown list, press Add Data Source.
In the Add Database Data Source dialog:
Enter the connection name. It must be unique among all configured databases.
Select the DB engine of the data source.
Enter the source information in the tabs. The displayed tabs and fields depend on the selected DB engine. For more details about specific tabs and parameters, go to the Engine-Specific Parameters section later in the document.
 To perform scanning, it is necessary to fill in all fields in the Connection tab. A data source with missing values can be saved but can’t be scanned.
Press the Save button to save the source.
The tag repository is maintained synchronously/asynchronously between mMC and mConsole based on the online/offline mode operation in mMC respectively.
In online mode, adding or removing tags is synchronized to mConsole right away. In offline mode, such changes are reflected in mConsole after the manual upload of the tagged sources.
Engine-Specific Parameters
For Oracle data sources, the Add/Edit Database Data Source dialog contains the following tabs:
Connection. Contains the following connection details:
Host
Port. A default port can be used.
User
Password
Identifier Type
Identifier
Service Name
CDB User
CDB Password
CDB SID
Scan. Contains the following scan settings:
Workload Repository options:
AWR (default)
Statspack
Dynamic Views
Tags. Allows assigning custom tags to the database. Assigning custom tags simplifies further filtering sources in mConsole.
During the scanning of AWR and Statspack repositories, the following requisite checks are performed:
Availability as a workload repository (AWR, Statspack).
Validity of the license (AWR).
Data sufficiency (AWR, Statspack).
Test Connectivity
Testing connectivity allows validation of the input data before scanning and without scanning. Do this to avoid running scanning that would result in errors because of incorrect connection parameters.
mMC has two ways of testing connectivity to sources:
Select a data source from the list and press the Test icon in the Actions panel.
Press the Test button in the Add Database Data Source or Edit Database Data Source dialog.
Data sources of instance type are tested fully even if only part of the instance databases is selected.
When running tests, the Processing dialog displays a list of the data source tiles. The dialog helps to track the progress of testing and see which data sources can be connected successfully and which cannot.
As the testing progresses, the progress icons near the file names will change to the success or error icons that represent the testing results:
Status | Description |
|---|---|
 | Testing is in progress. |
 | Testing is finished. mMC failed to connect to the data source. The accurate interpretation of status is displayed in the log. |
 | Testing is finished. mMC successfully tested the data source connection. The data source is ready for scanning. |
To continue working with other data sources during the testing, minimize the pop-up dialog.
To explore testing results in more detail, press the View Log button.
The log is shown in a table format and contains persisted information regarding the performed operations, their status, and additional information in case of failure.
Press the Log Directory button to open the folder where the logs are located.
Edit Database Data Source Configuration
To edit an existing data source configuration, use either of the ways:
Press the Edit icon inside the source tile.
Select the check box of the source and press the Edit icon in the Actions panel.
To edit several existing data source configurations:
Select data sources from the list and press the Edit icon in the Actions panel.
In the bulk edit dialog, for each source, edit the configuration.
Press the Save Current button.
Then, the next selected data source configuration appears.
When including an instance that is not fully selected in a bulk-edit operation, there’s a need to make a decision on whether or not to include that instance in the operation. Press:
Include and edit to include the instance in the operation.
Skip and edit to exclude the instance from the operation.
Cancel to cancel the editing process with no changes made.
Delete Database Data Source Configuration
To delete existing data sources, select them in the list and press the Delete icon in the Actions panel.
When deleting an instance that is not fully selected in a bulk-delete operation, there’s a need to make a decision on whether or not to include that instance in the operation. Press:
Include and delete to delete the instance.
Skip and delete to keep the instance.
Cancel to cancel the deletion process with no changes made.
Filter Data Sources
To filter the displayed data sources, use the Filter functionality. It allows searching by data source name and filtering by status or DB engine.
For example, it would help to find only previously unscanned Oracle data sources or filter out all data source databases that failed to be scanned.
Applied filters affect both database instances and databases contained within instances:
If the filter matches the criteria at the database level within an instance, the instance tile is expanded displaying only the databases that meet the criteria.
If only the instance itself matches the filter criteria, the instance tile without its internal databases is displayed.
Discover Databases
The database discovery feature allows identifying the data sources in the specific connection for their subsequent scanning.
The database discovery is available only for Oracle, PostgreSQL, MySQL, SQL Server, and DB2 LUW sources.
To discover databases, on the Databases tab:
Press the round + button in the lower-right corner.
Press Discover.
In the Data Source Discovery pop-up dialog, select DB engines and enter the hosts and ports for connections to discover. To discover multiple connections, enter the range of values. For example, in the Host field, you can enter 192.168.101.999-192.168.999.999.
Add as many rows as needed.
Press the Discover button.
After the source discovery is completed, select sources to save from the list and press the Save button.
Scan Database Data Sources
To scan databases, select them from the list and press the Scan button. It is possible to select a database, a whole instance, or a number of databases within an instance. Databases selected within an instance are processed individually (as separate databases).
After pressing the Scan button, the Processing dialog appears, providing information regarding the ongoing operations and their statuses. Processing information is retained until cleared, either manually or at the beginning of each session.
To explore scanning results in more detail, press the View Log button.
The log is shown in a table format and contains persisted information regarding the performed operations, their status, and additional information in case of failure.
Press the Log Directory button to open the folder where the logs are located.
Cancelling the scan operation is possible only for those data sources that haven’t been scanned yet.
Starting a new scan session is disabled while processing.
During the scanning, the data source tiles reflect the status:
Status | Description |
|---|---|
 | The data source number is bigger than the maximum thread number set in Scan Preferences. The data source is scheduled for scanning after the current processes are completed. |
 | Scanning is in progress. |
 | The scan results are being uploaded or saved locally. |
| Scanning is finished. mMC failed to scan, upload, or save the source. The accurate interpretation of status is displayed in the log. |
| Scanning is finished. mMC successfully scanned the data source and uploaded/saved the scan results. |
Incomplete Data Sources
If any data sources lack the necessary information, the notice near the Scan button indicates how many sources will be skipped due to the missing information.

Press View to see the list of incomplete data sources.
To include data sources in scanning:
Edit data sources and add the missing information.
Press Back.
Run scanning.
To proceed with only some of the data sources in the list, add the missing information only for them and press Back.
Scan in Background
While scanning is in progress, it is possible to continue working with data sources. To do that, minimize the Processing dialog and continue working in mMC.
To get back to the Processing dialog, press the chevron next to the Scan button.
The panel next to the Scan button indicates the processing state. It shows how many data sources from the total amount were processed.