Source Features
The Features section lists features affecting the migration complexity of the current source to the selected target.
Feature items are inferred from the data collected by mMC. They represent observations that may impact the migration effort and form the basis for calculating the overall migration score.
The Features section
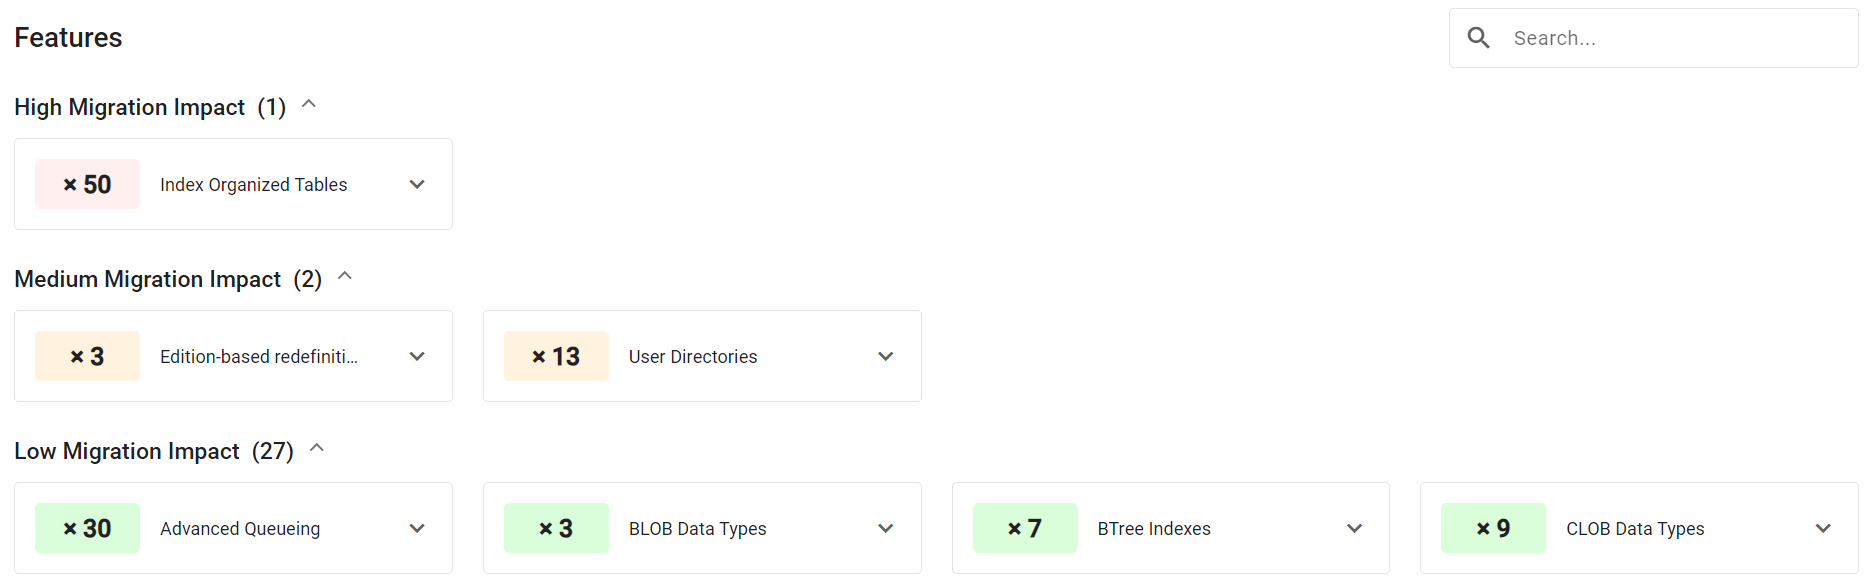
Feature List Subsections
The Features section lists features in up to three impact-level subsections:
High Migration Impact
Medium Migration Impact
Low Migration Impact
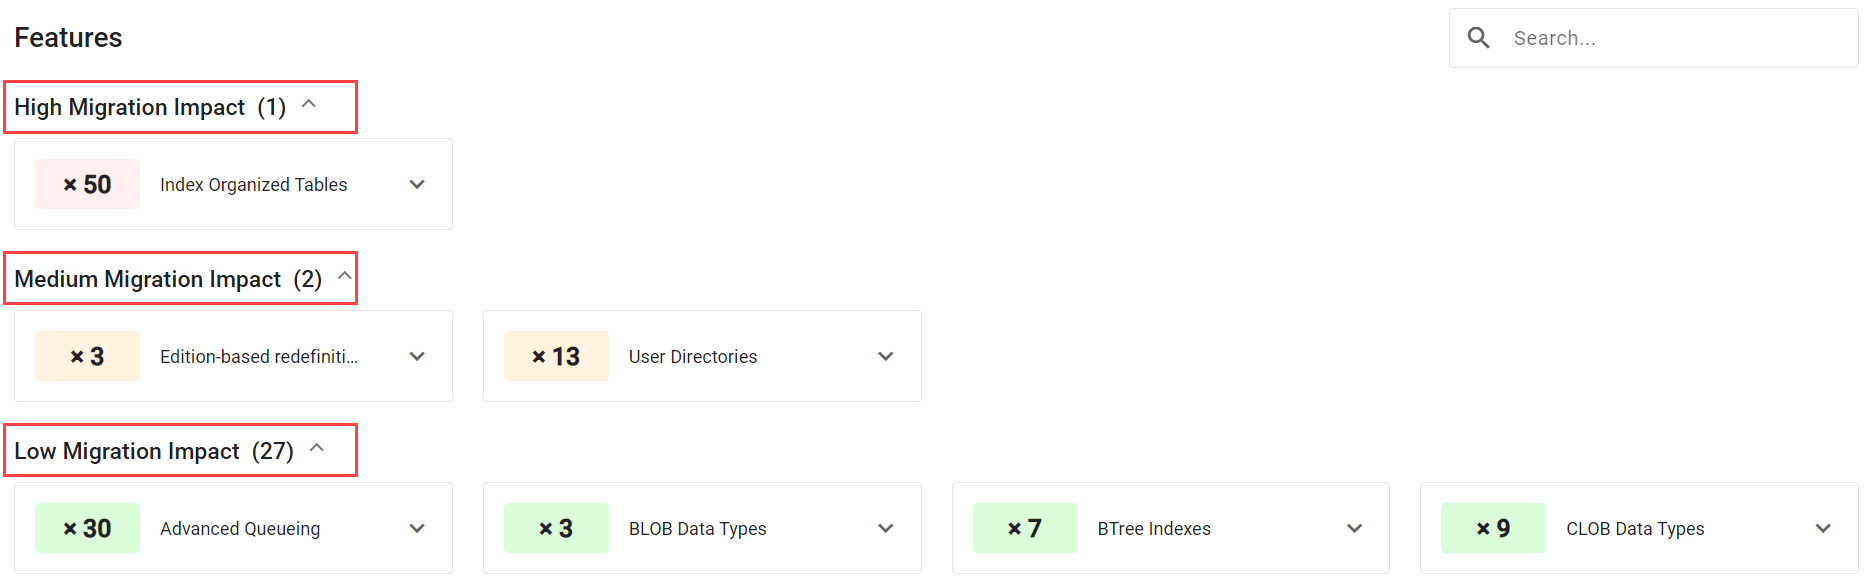
Migration impacts
Items are assigned to impact-level groups based on their score in the context of the current source and the currently selected target.
Changing the migration target causes features and scores to be re-calculated. Their impact and therefore their assignment to any particular group may change as well.
Within each of the three impact-level groups, an optional Excluded Features subsection may appear. The Excluded Features subsection contains items that belong to this impact level group, but which are not taken into account in the overall score for this source. Features inclusion and exclusion can be managed using Databases Management.
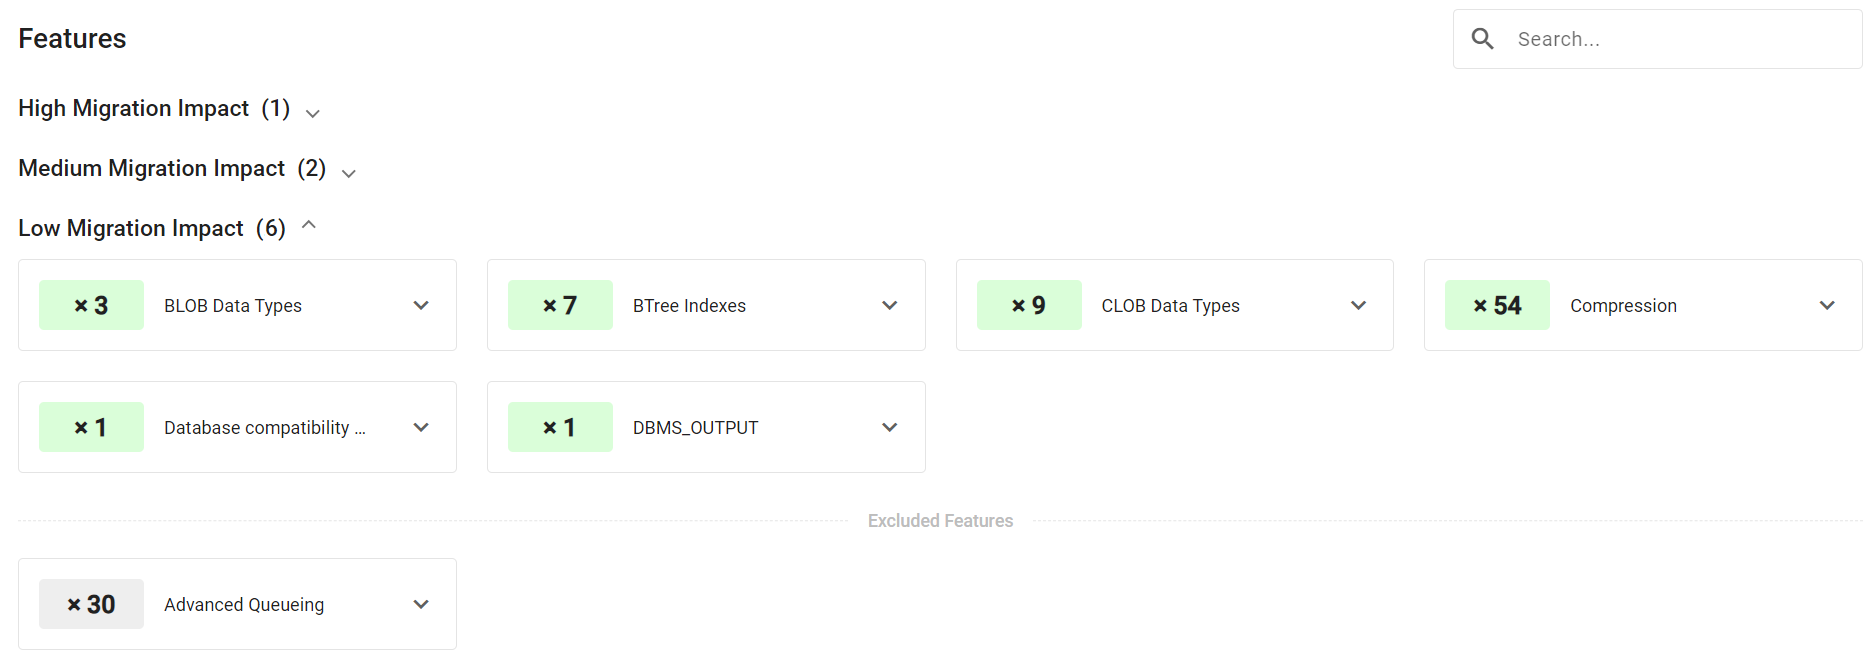
Low Migration Impact with an excluded item
The Not Analyzed subsection shows features that are not taken into consideration in any score calculation or migration insight.

The Not Analyzed subsection
Items within the Not Analyzed subsection appear un-shaded and non-expandable. Since these items are not analyzed at all, they provide no score contribution, and their impact on migration complexity is not determined. Feature information and location are not determined in this case, so there is no option to expand these items.
Features in the Not Analyzed group are those which were limited by licensing. Certain migVisor licenses restrict which or how many features are shown to the user.
To include features from the Not Analyzed subsection in score calculation, contact your license provider to obtain a different license.
Feature Filter
You can filter the features listed in the Features section.
Typing text (case insensitive) into the search filter returns results matching feature names. The term entered into the search box is compared to any given feature name. Features that do not match the filter are hidden.
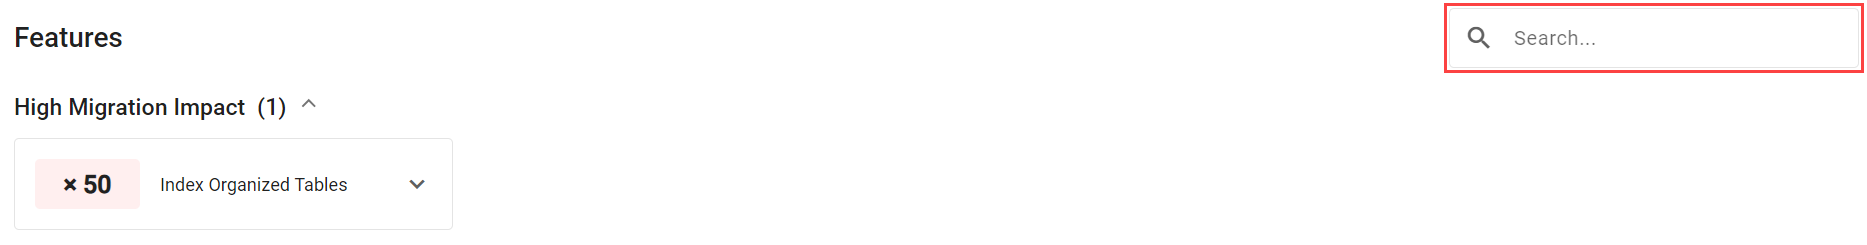
The Feature filter
Feature Items
Each feature item shows the feature name and a badge with a counter on it. The counter-badge shading indicates the cumulative complexity impact this individual feature has on the overall score. The color scheme is:
Red: High Migration Impact
Orange: Medium Migration Impact
Green: Low Migration Impact
Gray: Not Analyzed
Items are expandable. To expand or collapse an item, press the chevron icon to the right of the item’s name. Expanding the item reveals two tabs: Info and Location.
Info Tab
The Info tab describes a feature in the context of migration to the current target. The information varies from item to item and can include:
The nature of the feature.
Possible migration impact.
Possible mitigation steps.
Links to more information regarding the feature.
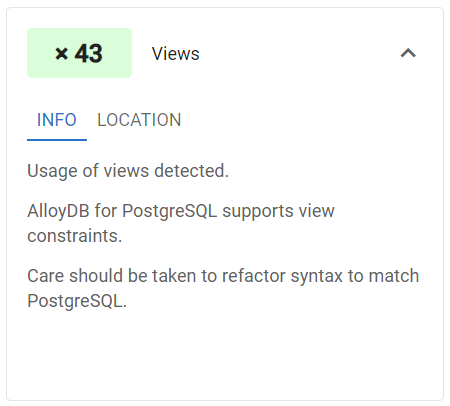
The Info tab
Location Tab
The Location tab is used to understand the underlying metadata driving this feature. It contains a heading with up to two levels of hierarchy.
The Hierarchy Labels describe the hierarchy of location values shown in the tree below it. The first label corresponds to the top-level values, and the optional second one to the optional descendant values.
In the example, Hierarchy Label Owner means that the top-level location node QS is the owner. The label Table Name means that each item under the node QS is a name of a table.
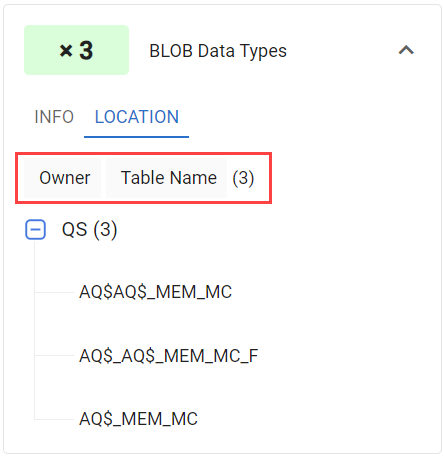
The Location tab and Hierarchy Labels
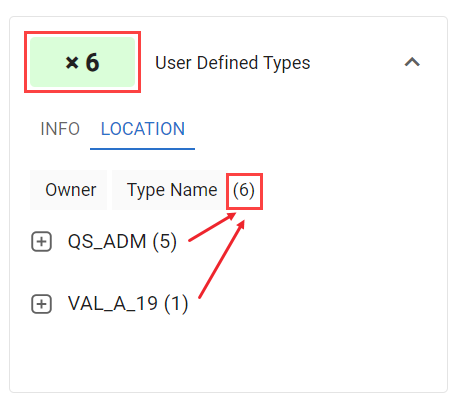
Feature Location Counts
How frequently a feature was detected plays a role in the complexity scoring. In the location tree, each top branch has a counter showing the number of final (leaf) values below it.
Following the Hierarchy Labels, the counter shows the total final values (leaves) number across all tree branches. This same count is shown at the top of the feature item, so that it is available even when the item is collapsed.
Feature counts