Report Export
Reports about the scanned sources can be exported and used for various offline purposes.
Exported reports include all currently filtered sources. Each DB engine has its own report format. All filtered sources of a DB engine are included in that DB engine report. In cases when sources are of multiple DB engines, the export function generates separate reports, one for each DB engine.
The export functionality is available from:
The Databases page.
The Single Database page.
The Source Management → Databases page.
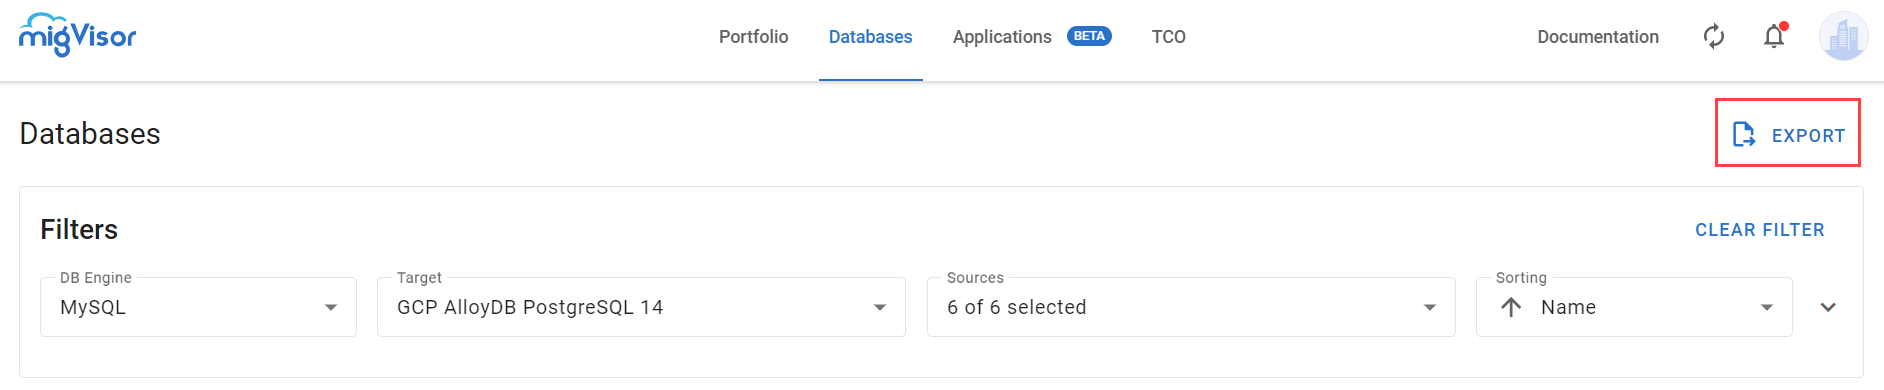
The Databases page
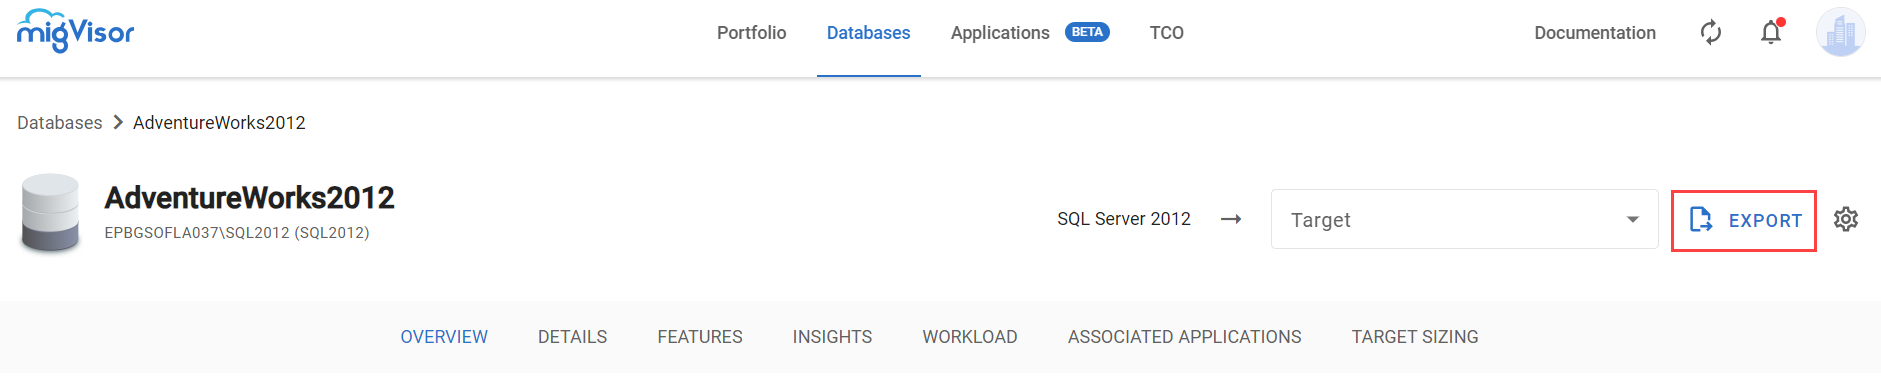
The Single Database page
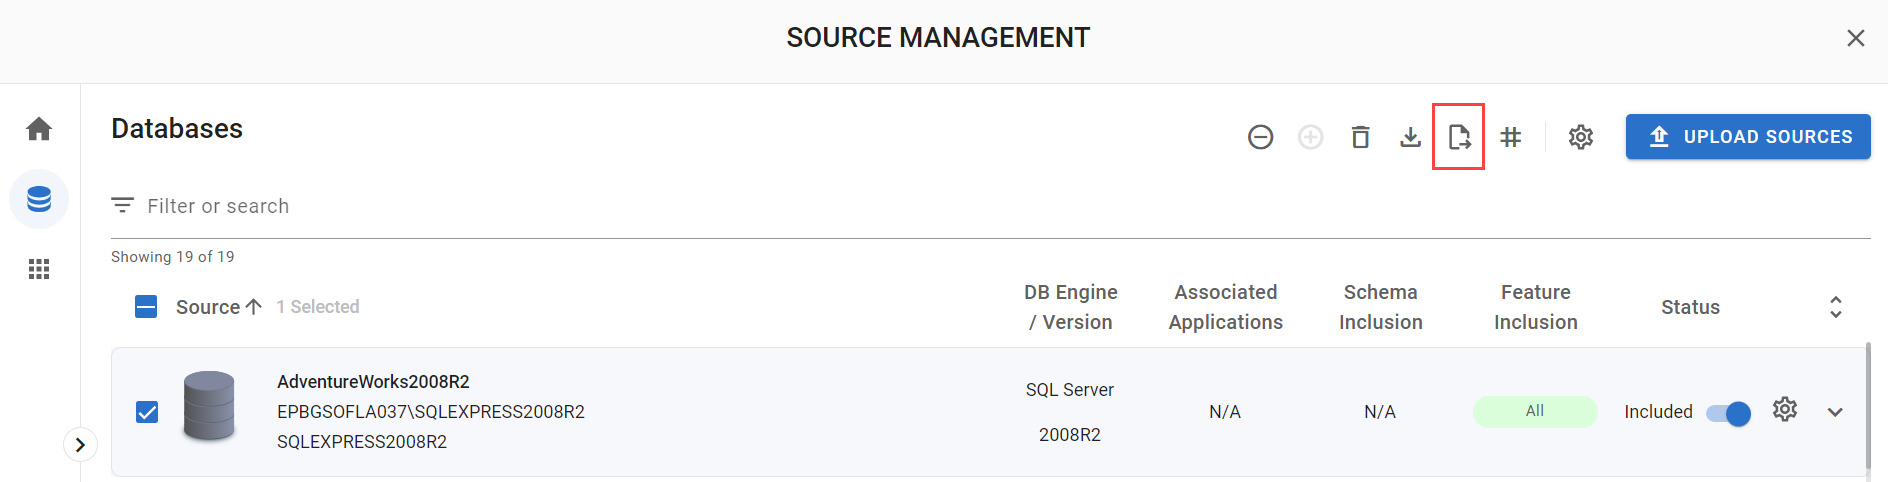
The Source Management → Databases page
Once the reports are ready, the download starts.
The report name includes:
“source analysis” if the target is specified.
“source discovery” if the target is not specified.
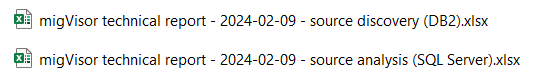
Generated reports in the web browser
Report Contents
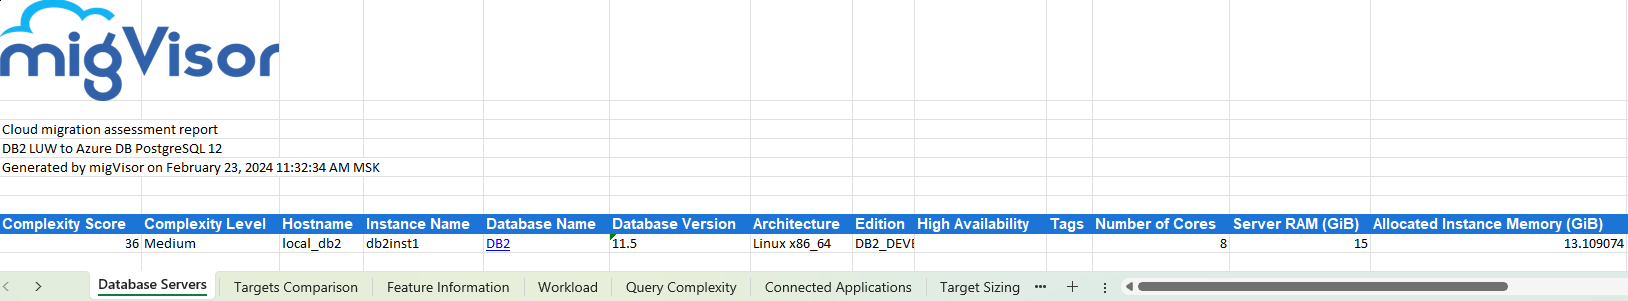
The report header includes information about the time and date on which the report was generated.
Your migVisor license determines the depth and scope of information included in the report. The report header will indicate if any information was omitted due to licensing.
In case you need any further clarifications, please contact the migVisor support at migVisor_support@epam.com.
The report is exported as an Excel spreadsheet. It comprises all the source objects found by the scan including tables, functions, indexes, features, migration insights, and their impact on the migration complexity.
A source discovery report excludes:
The Targets Comparison sheet (for RDBMS sources).
The Feature ID column on the <Database Name> sheet (for RDBMS sources).
The Complexity Score and Complexity Level columns on the Database Servers sheet.
In the report, a cell is empty if a value is missing. If the value is 0, 0 is displayed.
All memory and storage parameter values are displayed in GiB.
Report content by DB engine:
Sheet Name | Description |
|---|---|
Database Servers | General summary on the discovered databases, their migration complexity score, and migration complexity level. In the Database Name column, the names are clickable. Click a database name to move to a corresponding sheet to see details of a particular database (see the description of <Database Name> below). |
Targets Comparison | Alternative cloud platforms available for migration and complexity levels for each selected database to migrate thereon. Depend on the basic source and target selection. |
Feature Information | Summary on the features found in all discovered databases. Includes features IDs, names, and descriptions. Excluded features are not shown in the features list. |
Workload | OLTP vs. Analytic Query statistics. |
Query Complexity | Average complexity of the queries executed on the source. It depends on the Query Execution Plan—a number of steps needed to fulfill the query. The higher the number of steps, the higher the workload complexity. |
Connected Applications | Applications connected to the databases. For details, see Applications Management. |
Target Sizing | Key findings in the source which are useful in determining sizing for the target. For details, see Source Target Sizing. |
Schemas | Schemas found in the discovered databases and their migration scores. |
<Database Name> | Lists of features found in each discovered database and their migration scores. Split by database hostnames. |
Sheet Name | Description |
|---|---|
Clusters | General summary on the scanned HBase databases, their ZooKeeper quorum address, and storage usage. In the Cluster Name column, cluster IDs are clickable. Click a cluster ID to navigate to the corresponding sheet to see details of a particular cluster (see the description of <Cluster Name> below). |
Feature information | Feature names, description, and occurrence counts for the features detected in the scanned HBase. |
Migration Insights | Migration insights related to each cluster, alongside their supporting values. |
Associated Applications | Associated applications connected to the source. |
Target Sizing | Key findings in the source which are useful in determining sizing for the target. |
Physical Layout | Information about the hosts and nodes that HBase is running on. This includes HMaster and RegionServer hosts. It does not include replication targets, ZooKeeper, or Hadoop participants (unless the host is shared with the HBase components). The tab breaks down store file counts, store file size, and uncompressed store file size. |
Logical Layout | Row for each column family. It includes table and column family settings. |
Configurations | Key configuration entries retrieved during the scan. |
<Cluster Name> | For each HBase cluster in the report, there is a dedicated sheet for the cluster named after the cluster id. The sheet contains the features, their source hierarchy, and values for the cluster. |
Sheet Name | Description |
|---|---|
Clusters | General summary on the discovered clusters, their migration complexity score, and migration complexity level. In the Cluster Name column, the clusters names are clickable. Click a cluster name to move to a corresponding sheet to see details of a particular cluster (see the description of <Cluster Name> below). |
Feature Information | Summary on the features found in all the discovered clusters. Includes features IDs, names, and descriptions. Excluded features are not shown in the features list. |
Migration Insights | Migration insights related to each cluster, alongside their supporting values. |
Connected Applications | Shows applications connected to the clusters. For details, see Applications Management. |
Target Sizing | Key findings in the source which are useful in determining sizing for the target. For details, see Source Target Sizing. |
Topologies | Topology types of the discovered clusters and their migration scores. |
Source Artifacts | Total number of features found in the databases. For details, see Source Features. Excluded features are not included into the total count. |
<Cluster Name> | Features lists split by clusters topology—standalone, replica set, sharded—and their migration scores. |
Sheet Name | Description |
|---|---|
Database Servers | General summary on the discovered databases, their migration complexity score, and migration complexity level. In the Database Name column, the names are clickable. Click a database name to move to a corresponding sheet to see details of a particular database (see the description of <Database Name> below). |
Targets Comparison | Alternative cloud platforms available for migration and complexity levels for each selected database to migrate thereon. Depend on the basic source and target selection. |
Feature Information | Summary on the features found in all discovered databases. Includes features IDs, names, and descriptions. Excluded features are not shown in the features list. |
Workload | OLTP vs. Analytic Query statistics. May have different sets of metrics based on the activation of Extended Scan. |
Query Complexity | Average complexity of the queries executed on the source. It depends on the Query Execution Plan—a number of steps needed to fulfill the query. The higher the number of steps, the higher the workload complexity. |
Workload Statistics | Statistical information regarding workload characteristics, mostly collected via Extended Scan. |
Connected Applications | Applications connected to the databases. For details, see Applications Management. |
Target Sizing | Key findings in the source which are useful in determining sizing for the target. For details, see Source Target Sizing. May have different sets of metrics based on the activation of Extended Scan. |
<Database Name> | Lists of features found in each discovered database and their migration scores. Split by database hostnames. |
Sheet Name | Description |
|---|---|
Database Servers | General summary on the discovered databases, their migration complexity score, and migration complexity level. In the Database Name column, the names are clickable. Click a database name to move to a corresponding sheet to see details of a particular database (see the description of <Database Name> below). |
Targets Comparison | Alternative cloud platforms available for migration and complexity levels for each selected database to migrate thereon. Depend on the basic source and target selection. |
Feature Information | Summary on the features found in all discovered databases. Includes features IDs, names, and descriptions. Excluded features are not shown in the features list. |
DMS Insights | Findings showing the status of prerequisites (met/not met) in order to use the Data Migration Service (DMS) tool for cloud migration. In the case of a multi-vendor license, the insights are displayed in separate sheets that include the CSP name to indicate the associated cloud vendor. |
Sizing Insights | Informational findings that help determine the sizing of the machine to be used for the selected target. |
IaaS Insights | Findings providing information about migrating to the selected Infrastructure as a Service (IaaS) platform. |
RDS Insights | Findings showing the status of prerequisites (met/not met) for migrating to an RDS target. For Amazon vendors only. |
RDS Custom Insights | Findings showing the status of prerequisites (met/not met) for migrating to an RDS Custom target. For Amazon vendors only. |
Licensing Insights | Findings providing information and attention notices to support Oracle license optimizations. |
Exadata Insights | Findings providing information to support database workload optimizations. |
Workload | OLTP vs. Analytic Query statistics. |
Query Complexity | Average complexity of the queries executed on the source. It depends on the Query Execution Plan—a number of steps needed to fulfill the query. The higher the number of steps, the higher the workload complexity. |
Connected Applications | Applications connected to the databases. For details, see Applications Management. |
Target Sizing | Key findings in the source which are useful in determining sizing for the target. For details, see Source Target Sizing. |
Schemas | Schemas found in the discovered databases and their migration scores. |
<Database Name> | Lists of features found in each discovered database and their migration scores. Split by database hostnames. |
Sheet Name | Description |
|---|---|
Database Servers | General summary on the discovered databases, their migration complexity score, and migration complexity level. In the Database Name column, the names are clickable. Click a database name to move to a corresponding sheet to see details of a particular database (see the description of <Database Name> below). |
Targets Comparison | Alternative cloud platforms available for migration and complexity levels for each selected database to migrate thereon. Depend on the basic source and target selection. |
Feature Information | Summary on the features found in all discovered databases. Includes features IDs, names, and descriptions. Excluded features are not shown in the features list. |
Workload | OLTP vs. Analytic Query statistics. May have different sets of metrics based on the activation of Extended Scan. |
Query Complexity | Average complexity of the queries executed on the source. It depends on the Query Execution Plan—a number of steps needed to fulfill the query. The higher the number of steps, the higher the workload complexity. |
Workload Statistics | Statistical information regarding workload characteristics, mostly collected via Extended Scan. |
Connected Applications | Applications connected to the databases. For details, see Applications Management. |
Target Sizing | Key findings in the source which are useful in determining sizing for the target. For details, see Source Target Sizing. May have different sets of metrics based on the activation of Extended Scan. |
Schemas | Schemas found in the discovered databases and their migration scores. |
<Database Name> | Lists of features found in each discovered database and their migration scores. Split by database hostnames. |
Sheet Name | Description |
|---|---|
Database Servers | General summary on the discovered databases, their migration complexity score, and migration complexity level. In the Database Name column, the names are clickable. Click a database name to move to a corresponding sheet to see details of a particular database (see the description of <Database Name> below). |
Targets Comparison | Alternative cloud platforms available for migration and complexity levels for each selected database to migrate thereon. Depend on the basic source and target selection. |
Feature Information | Summary on the features found in all discovered databases. Includes features IDs, names, and descriptions. Excluded features are not shown in the features list. |
DMS Insights | Findings showing the status of prerequisites (met/not met) in order to use the Data Migration Service (DMS) tool for cloud migration. In the case of a multi-vendor license, the insights are displayed in separate sheets that include the CSP name to indicate the associated cloud vendor. |
Sizing Insights | Informational findings that help determine the sizing of the machine to be used for the selected target. |
IaaS Insights | Findings providing information about migrating to the selected Infrastructure as a Service (IaaS) platform. |
RDS Insights | Findings showing the status of prerequisites (met/not met) for migrating to an RDS target. For Amazon vendors only. |
RDS Custom Insights | Findings showing the status of prerequisites (met/not met) for migrating to an RDS Custom target. For Amazon vendors only. |
Licensing Insights | Findings providing information and attention notices to support SQL Server license optimizations. |
Workload | OLTP vs. Analytic Query statistics. |
Query Complexity | Average complexity of the queries executed on the source. It depends on the Query Execution Plan—a number of steps needed to fulfill the query. The higher the number of steps, the higher the workload complexity. |
Connected Applications | Applications connected to the databases. For details, see Applications Management. |
Target Sizing | Key findings in the source which are useful in determining sizing for the target. For details, see Source Target Sizing. |
<Database Name> | Lists of features found in each discovered database and their migration scores. Split by database hostnames. |